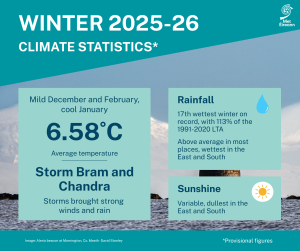
Bhí míonna na Nollag agus Feabhra séimh, agus bhí mí Eanáir fionnuar. Fliuch i Lár na Tíre, sa Deisceart agus san Oirthear
Bhí Geimhreadh 2025/26 fliuch i Lár na Tíre, sa Deisceart agus san Oirthear mar gheall ar scairdsruth a bogadh ó dheas agus sraith córas ísealbhrú a bhog go mall lenar tugadh bandaí báistí fronta arís agus arís ag teacht aneas, ach bhí aimsir ní ba thirime ná an meán san Iarthuaisceart. Bhí an aimsir séimh i ngach áit agus bhí teochtaí os cionn an mheáin le haghaidh an séú séasúr as a chéileLe Stoirm Bram an 9 Nollaig tháinig gálaí láidre agus an teocht ab airde sa séasúr, arbh ionann í agus 17.2°C ag Páirc an Fhionnuisce, Co. Bhaile Átha Cliath. De bharr Stoirm Chandra an 27 Eanáir bhí bháisteach throm forleathan agus gála fórsa stoirme ag stáisiún amháin, Cionn Mhálanna, Co. Dhún na nGall.
Príomhfhigiúirí:
- B’ionann meánteocht geimhridh náisiúnta 2025/25 (agus tacar sonraí Oileán na hÉireann á úsáid*) agus 6.58 °C, 1.21 °C os cionn MFT 1961-1990 agus 0.58 °C os cionn MFT 1991-2020.
- Is é geimhreadh 2025/26 an 20ú geimhreadh is séimhe ó bhí 1900 ann.
- Bhí an mheánbháisteach ghreillithe náisiúnta le haghaidh Gheimhreadh 2025/26 ní ba fhliche ná mar atá de ghnáth ag 113% de MFT 1991-2020 (428.2mm), rud a rangaítear mar an 17ú geimhreadh is fliche (nó an 69ú ceann is tirime).
- Ag Caisleán Bhaile Sheáin, Co. Loch Garman, taifeadadh an geimhreadh ba fhliche ó bhí 2016 ann (agus an dara ceann ba fhliche ó tosaíodh taifid ann 84 bliain ó shin) agus taifeadadh an bháisteach laethúil ab airde ann Dé Domhnaigh an 14 Nollaig, arbh ionann í agus 51.1 mm.
Buaicphointí Ráitis Aeráide le haghaidh an Gheimhridh.
Bhí geimhreadh 2025/26 séimh i ngach áit, rud a d’fhágann gurb é an séú séasúr as a chéile ina raibh teochtaí os cionn an mheáin.Bhí mí na Nollag agus mí Feabhra os cionn an mheáin, ach bhí mí Eanáir ní b’fhionnuaire ná an meán. De bharr scairdsruth ag bogadh ó dheas, bhí geimhreadh fliuch i Lár na Tíre, sa Deisceart agus san Oirthear, ach bhí aimsir ní ba thirime ná an meán san Iarthuaisceart.
Bhain meascán le mí na Nollag toisc go raibh ísealbhrú Atlantaigh i réim ar feadh an chéad dá thrian den mhí, rud a raibh aimsir shéimh, fhliuch agus ghaofar uaireanta mar thoradh air. Bhí an trian deireanach fionnuar, tirim agus ní raibh sé chomh gaofar a luaithe a tháinig ardbhrú sa tuaisceart chun cinn. Mar thoradh air sin, bhí an aimsir fuar agus tirim, den chuid ba mhó, ag tús mhí Eanáir agus bhí tréimhsí taitnimh gréine geimhridh úire agus sioc forleathan san oíche ann sular tháinig ísealbhrú chun cinn i dtreo dheireadh na chéad seachtaine.
Sa dara leath de mhí Eanáir agus sa chéad dá thrian de mhí Feabhra, dhírigh scairdsruth láidir an Atlantaigh Thuaidh a bogadh ó dheas sraith córas ísealbhrú i dtreo na tíre ón iardheisceart. Ag an am céanna, de bharr córas ardbhrú blocála fuachta thar thuaisceart agus oirthear na hEorpa, mhoilligh nó stad na córais sin siar ó dheas ó Éirinn. Mar gheall ar an bpatrún sin bhí bandaí báistí fronta arís agus arís eile ag teacht aneas, rud a bhí ina chúis le tréimhsí fada báistí troime, a bhí comhchruinnithe thar Dheisceart agus Oirthear na tíre. Ag deireadh an tséasúir bhí gaotha aniar Atlantacha ann arís mar is gnáth.
Báisteach: Os cionn an mheáin ag formhór na stáisiún, ba fhliche san Oirthear agus sa Deisceart
Bhí an chuid ba mhó de na hiomláin báistí míosúla os cionn a Meáin Fhadtéarmaigh (MFT) don tréimhse 1991-2020. Bhí an céatadán de na luachanna báistí séasúraí idir 79% (279. mm) ag Fionnúir, Co. Dhún na nGall agus 174% (iomlán báistí séasúraí 509.1 mm) ag Caisleán Bhaile Sheáin, Co. Loch Garman ( an geimhreadh ba fhliche ann ó bhí 2016 ann agus an dara geimhreadh ba fhliche ó tosaíodh taifid a choinneáil in 1942). Bhí na hiomláin bháistí séasúraí idir 266.4mm (87% dá MFT) ag Aerfort na Sionainne, Co. an Chláir agus 532.0mm (106% dá MFT) ag Réadlann Dhairbhre, Co. Chiarraí. Ba é an t-iomlán báistí laethúla ab airde ná 51.1 mm ag Caisleán Bhaile Sheáin, Co. Loch Garman Dé Domhnaigh an 14 Nollaig (an bháisteach laethúil is airde le haghaidh an gheimhridh atá ar taifead).
Bhí líon na laethanta báistí* idir 61 lá ag Aerfort Bhaile Átha Cliath agus ag Aeradróm Mhic Easmainn, Co. Bhaile Átha Cliath araon agus 77 lá ag Baile Uí Fhiacháin, Co. Mhaigh Eo. Bhí líon na laethanta fliucha* idir 48 lá ag Aerfort Bhaile Átha Cliath agus 67 lá ag Réadlann Dhairbhre, Co. Chiarraí. Bhí líon na laethanta an-fhliuch* idir 3 lá ag Aerfort na Sionainne, Co. an Chláir agus 20 lá ag Réadlann Dhairbhre, Co. Chiarraí . Bhí dhá thréimhse thirime i rith an gheimhridh, ag Aerfort Bhaile Átha Cliath agus ag Páirc an Fhionnuisce, Co. Bhaile Átha Cliath idir Dé Domhnaigh an 21 Nollag agus Dé Máirt an 6 Eanáir a mhair idir 15 agus 17 lá.
Chomh maith le Caisleán Bhaile Sheáin, bhí an geimhreadh ba fhliche ag cúig stáisiún eile, an chuid ba mhó san Oirthear, ó bhí 2016 ann. Ba iad sin Aerfort Bhaile Átha Cliath ag a raibh 319.8 mm (172% dá MFT), Páirc an Fhionnuisce ag a raibh 324.5 mm (172% dá MFT), Aeradróm Mhic Easmainn, Co. Bhaile Átha Cliath ag a raibh 280.6 mm (143% dá MFT), an Muileann gCearr, Co. na hIarmhí ag a raibh 334.8 mm (125% dá MFT) agus Dún Samhnaí, Co. na Mí ag a raibh 309.8 mm (138% dá MFT).
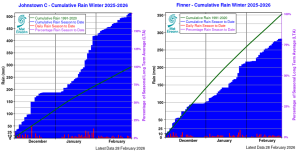
Iomláin bháistí shéasúracha charnacha ag Caisleán Bhaile Sheáin, Co. Loch Garman (ar chlé) agus Fionnúir, Co. Dhún na nGall (ar dheis) i ngeimhreadh 2025/26, i gcoibhneas leis an meán séasúrach fadtéarmach
Teocht: Os cionn an mheáin i ngach áit
Bhí na meánteochtaí aeir go léir ar fud na tíre os cionn a MFT le haghaidh an tséasúir. Bhí athruithe ó mheánteocht an aeir idir 0.1 °C ag Béal an Mhuirthead, Co. Mhaigh Eo agus ag Réadlann Dhairbre, Co. Chiarraí (meánteocht 6.9 °C, 7.8 °C faoi seach) agus 1.0 °C ag Páirc an Fhionnuisce, Co. Bhaile Átha Cliath (meánteocht 6.5 °C). Bhí meánteochtaí an tséasúir idir 5.1 °C (0.6 °C os cionn a MFT) ag Aerfort Chnoc Mhuire, Co. Mhaigh Eo agus 8.2 °C (0.3 °C os cionn a MFT) ag Inis Arcáin, Co. Chorcaí. Tuairiscíodh teocht ab airde an tséasúir ag Páirc an Fhionnuisce Dé Máirt an 9 Nollag (le linn Stoirm Bram), lá ar a raibh an teocht cothrom le 17.2 °C (an uasteocht is airde i mí Feabhra ó bhí 1998 ann). Taifeadadh íosteocht aeir ab ísle na míosa Dé Domhnaigh an 4 Eanáir ag Baile Átha an Rí, Co. na Gaillimhe, arbh ionann í agus -5.3 °C, agus bhí an íosteocht féir ab ísle a tuairiscíodh cothrom le -10.9 °C ag Marcréidh, Co. Shligigh, Dé Sathairn, an 14 Feabhra.
Tuairiscíodh sioc aeir agus talún i rith an tséasúir ag gach stáisiún. Bhí líon na laethanta nuair a bhí sioc talún ann idir 19 lá ag Ceann Mhása, Co. na Gaillimhe agus ag Inis Arcáin, Co. Chorcaí agus 52 lá ag Marcréidh, Co. Shligigh. Bhí líon na laethanta nuair a bhí sioc talún ann idir lá amháin ag cúpla stáisiún agus 27 lá ag an gCloch Liath, Co. Chorcaí. In éineacht le Páirc an Fhionnuisce, bhí an uasteocht ab airde le haghaidh an gheimhridh ó bhí 1998 ann Dé Máirt an 9 Nollaig ag dhá stáisiún eile, Aerfort Bhaile Átha Cliath (16.3 °C) agus Béal Átha hÉis, Co. an Chabháin (15.6 °C) agus bhí an uasteocht ab airde le haghaidh an gheimhridh ó bhí 1949 ann ag Aerfort na Sionainne, Co. an Chláir (15.7 °C), rud a tharla Dé Máirt an 9 Nollaig freisin (i rith Stoirm Bram) .
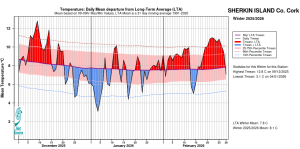
Teocht ag Inis Arcáin, Co. Chorcaí: Athrú ar mheánteocht laethúil ó MFT i ngeimhreadh 2025/26 bunaithe ar luachanna Uasta/Íosta 09-09 uair.
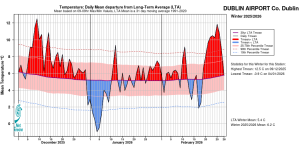
Teocht ag Aerfort Bhaile Átha Cliath Co. Bhaile Átha Cliath:Athrú ar mheánteocht laethúil ó MFT i ngeimhreadh 2025/26 bunaithe ar luachanna Uasta/Íosta 09-09 uair
Taitneamh gréine:Aimsir ghruama san Oirthear agus sa Deisceart, ach seachas sin gar don mheán
Bhí an céatadán de na luachanna taitnimh gréine MFT athraitheach (nuair a bhí siad ar fáil) ar fud na tíre. Bhí an céatadán de na luachanna taitnimh gréine shéasúraigh idir 89% (167.5 uair an chloig) ag Aeradróm Mhic Easmainn Co. Baile Átha Cliath agus 100% (156.6 uair an chloig) ag Aerfort na Sionainne, Co. an Chláir. Bhí na hiomláin taitnimh gréine shéasúraigh idir 128.6 uair an chloig (Níl comparáid MFT ar fáil*) ag Béal an Mhuirthead, Co. Mhaigh Eo agus 182.0 uair an chloig (Níl comparáid MFT ar fáil*) ag Caisleán Bhaile Sheáin, Co. Loch Garman. Ba é 8.3 uair an chloig ag Aerfort Chorcaí, Co. Chorcaí Dé Domhnaigh an 1 Feabhra an líon ab airde uaireanta taitnimh gréine laethúil a taifeadadh an séasúr seo. Bhí líon na laethanta gruama* idir 31 lá ag Réadlann Dhairbhre, Co. Chiarraí agus 44 lá ag Aerfort na Sionainne, Co. an Chláir. Bhí an geimhreadh ba ghruama ag Aerfort Bhaile Átha Cliath ó bhí 1994 ann, áit a raibh 158.9 uair an chloig.
Gaoth: Tuairiscíodh gaotha fórsa stoirme le linn Stoirm Chandra agus gálaí láidre le linn Stoirm Bram
Bhí na meánluasanna gaoithe séasúracha idir 5.8 muirmhíle san uair (10.7 km/u) ag an gCloch Liath, Co. Chorcaí agus 17.4 muirmhíle san uair (32.2 km/u) ag Cionn Mhálanna, Co. Dhún na nGall. Tuairiscíodh gálaí a lán laethanta, agus tuairiscíodh gálaí láidre ar an 9 Nollaig le linn Stoirm Bram, an 25 Eanáir, an 27 Eanáir le linn Stoirm Chandra agus an 5 agus an 6 Feabhra. Tuairiscíodh gaotha fórsa stoirme ag stáisiún amháin le linn an tséasúir, ag Cionn Mhálanna, Co. Dhún na nGall, Dé Máirt an 27 Eanáir le linn Stoirm Chandra.Bhí líon na laethanta le gálaí idir lá ar bith ag cúpla stáisiún agus 24 lá ag Cionn Mhálanna, Co. Dhún na nGall. Ní raibh aon laethanta nuair a bhí gálaí láidre ann ag formhór na stáisiún ach bhí 5 lá den sórt sin ag Cionn Mhálanna, Co Dhún na nGall. Tuairiscíodh séideán agus meánluas gaoithe 10 nóiméad ab airde an tséasúir ag Cionn Mhálanna, Co. Dhún na nGall Dé Máirt an 27 Eanáir. B’ionann an séideán ab airde agus 70 muirmhíle san uair (130 km/u) agus b’ionann an meánluas gaoithe 10 nóiméad ab airde agus 56 muirmhíle (104 km/u). Bhí an mheánghaoth ab ísle le haghaidh an gheimhridh ó bhí 2011 ann ag ceithre stáisiún san Iarthar.
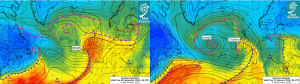
Cairt Anailíse Aermhaise 06 AUL 09 Eanáir 2025 (ar chlé): Bhog Stoirm Bram ó thuaidh, díreach ar an taobh thiar d’Éirinn, rud a chruthaigh aermhais mhuirí thrópaiceach an-te. Cairt Anailíse Aermhaise 12 AUL 27 Eanáir 2026 (ar dheis): Bhog Stoirm Chandra ó thuaidh feadh iarthar na hÉireann, rud a chruthaigh frontaí aimsire gníomhaí.
Tá tuarascáil PDF agus cairteacha ar fáil anseo (roghnaigh Geimhreadh ar an roghchlár anuas le haghaidh na míosa).
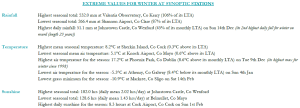
Luachanna foircneacha ag stáisiúin shionoptacha i ngeimhreadh 2025/26.
Notes to Editor:
- *Issued by Met Éireann on Wednesday 4th March 2026. This report is based on available preliminary data from 25 principal weather stations operated by Met Éireann. Synoptic station data is midnight to midnight UTC. Long-Term Averages (LTAs) and “average” refer to the period 1991-2020 unless stated.
- A rain day is a day on which 0.2 mm or more of rainfall is measured. A wet day is a day with 1.0 mm or more of rainfall. A dull day is a day with less than 0.5 hours of sunshine. A very wet day is a day with 10.0 mm or more of rainfall.
- Climatological dry periods – An absolute drought is a period of 15 or more consecutive days to none of which is credited 0.2 mm or more of precipitation. A partial drought is a period of at least 29 consecutive days, the mean daily rainfall of which does not exceed 0.2 mm. A dry spell is a period of 15 or more consecutive days to none of which is credited 1.0 mm or more of precipitation (i.e. daily tot < 1.0 mm).
- A heatwave occurs where there are 5 consecutive days or more with maximum temperature over 25°C (that is, a daily maximum screen air temperature > 25° C).
- The ‘Island of Ireland’ dataset is 125 years long and runs between 1900 and 2023. For this dataset the long term averages from the 1961-1990 reference period are used for comparison as is standard for long-term climate change assessments.
- Sunshine data is from the Autosol Network. LTAs for these sites are currently not used for comparison purposes.
- For more information or interview opportunities with a Met Éireann spokesperson, please contact us at enq@met.ie.