Ireland’s 30-year Climate Averages
Climate averages, sometimes referred to as ‘climate normals’, are the mean or average values of a climate variable over a standard reference period. The World Meteorological Organization (WMO) established that the length of the reference period should be 30 years, with a recommendation to update the climate averages every 10 years to provide representative reference values for recent climatic conditions.
Climate averages are used for two principal purposes. They provide information about typical weather conditions at a particular location, and they serve as a benchmark against which recent or current observations can be compared, including providing a basis for many anomaly-based climate datasets. They are also widely used as a reference baseline to provide context for future climate projections.
In accordance with WMO guidelines, Met Éireann has compiled a set of climate averages for the period 1991-2020 for a range of parameters including air temperature, precipitation, sunshine and wind. Annual, seasonal, and monthly average values for the period 1991-2020 were compiled using high quality data obtained from Met Éireann’s observation network.
Click on the Storymap below to find out more:
Ireland’s Climate Averages (1991-2020) Summary Report presents a summary of the latest set of climate averages for Ireland as well as an assessment of trends between the two 30-year averaging periods, 1961-1990 and 1991-2020. To facilitate a comparison with the previous 30-year period (1961-1990), a consistent high-quality dataset spanning the entire 60-year period was developed. Multiple Analysis of Series for Homogenisation (MASH) software was applied to a selection of long-term air temperature and rainfall stations in the network. Values are averaged for each month over the 30-year period to obtain the long-term average. In the case of air temperature and rainfall, gaps in observational data are estimated using data from neighbouring stations.
Long-term averages for stations are then used to generate maps and gridded data at a 1 km resolution for air temperature and rainfall. It should be noted that to interpret a climate parameter at a particular location using the 1 km grid it is recommended to use the average of grid points surrounding the area, as details of local variations (slope, elevation etc.) are lost at this resolution. Averaging over nearby grid points helps to smooth out the effects of these variations and give a more realistic climate parameter value.
Going forward, weather and climate statistics will reference the new long-term average period 1991-2020, unless otherwise stated. These will replace the 1981-2010 long-term averages that are currently in use. The historical baseline period of 1961-1990 will be retained for use in climate change assessments.
Climatological Reports (see links below) are now available providing details of quality control and homogenisation methods along with a description of the infilling and gridding techniques used to generate the 1991-2020 long term averages (LTA). Also described are more detailed findings relating to the 1991-2020 LTA and a comparison with a previous LTA period, 1961-1990.
Long-term rainfall averages for Ireland 1991-2020
Long-term air temperature averages for Ireland 1991-2020
As part of the work in generating the 1991-2020 LTA, gridded datasets for maximum, minimum and mean air temperature and rainfall were calculated for 1961-1990, 1971-2000 and 1981-2010 periods and are available below under the appropriate averages section.
1991-2020 Averages
| Belmullet † | Kilkenny* |
| Birr* | Malin Head † |
| Casement | Mullingar* |
| Claremorris** | Roches Point** |
| Clones* | Rosslare* |
| Cork Airport | Shannon Airport |
| Dublin Airport | Valentia † |
* Stations closed in 2007/2008.
** Averages not available for this period.
† Stations do not have weather data over the full period and therefore Averages data is not available.
1991-2020 Temperature Grids [ZIP]
1991-2020 Rainfall Grids [ZIP]
The long term average data is subject to review and files may be updated if an amendment is required.
1981-2010 averages
| Belmullet | Kilkenny* |
| Birr* | Malin Head |
| Casement | Mullingar* |
| Claremorris** | Roches Point** |
| Clones* | Rosslare* |
| Cork Airport | Shannon Airport |
| Dublin Airport | Valentia |
* Stations closed in 2007/2008.
** Averages not available for this period.
Downloads
1981-2010 Climate Averages Summary [PDF]
1981-2010 Temperature Grids [ZIP]
1981-2010 Rainfall Grids [ZIP]
Station References
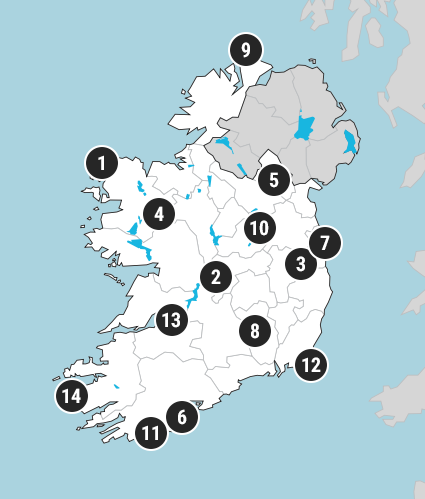
| 1. Belmullet | 8. Kilkenny |
| 2. Birr | 9. Malin Head |
| 3. Casement | 10. Mullingar |
| 4. Claremorris | 11. Roches Point |
| 5. Clones | 12. Rosslare |
| 6. Cork Airport | 13. Shannon Airport |
| 7. Dublin Airport | 14. Valentia |