Surface Pressure & Frontal Analysis at 00UTC Friday 31 July 2026
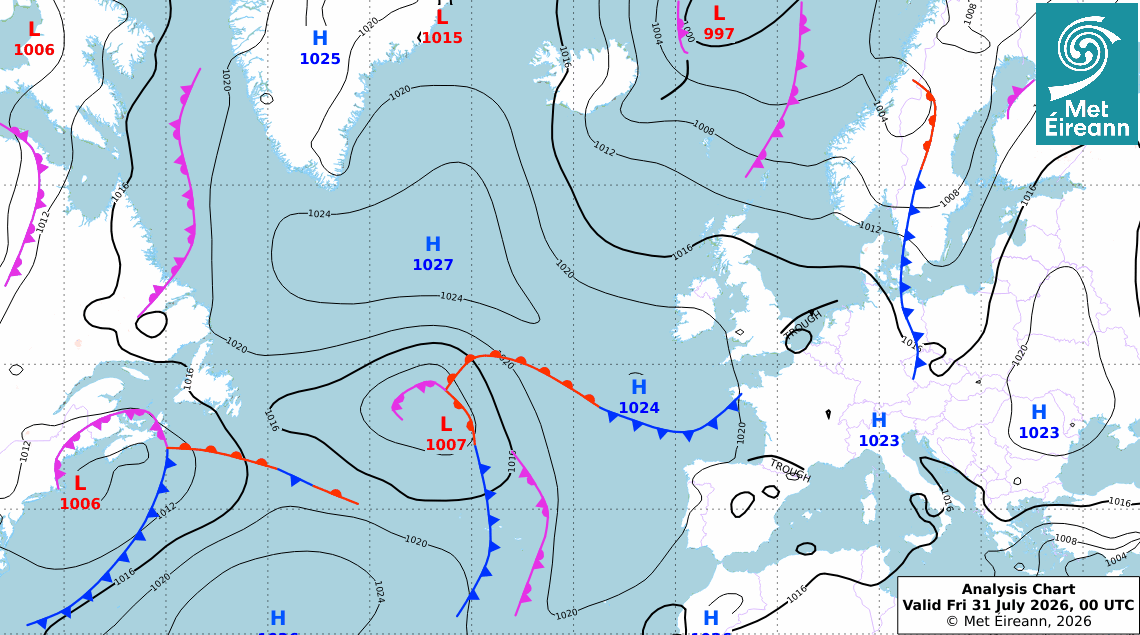
Read the latest Meteorological Situation in the Met Éireann Sea Area Forecast
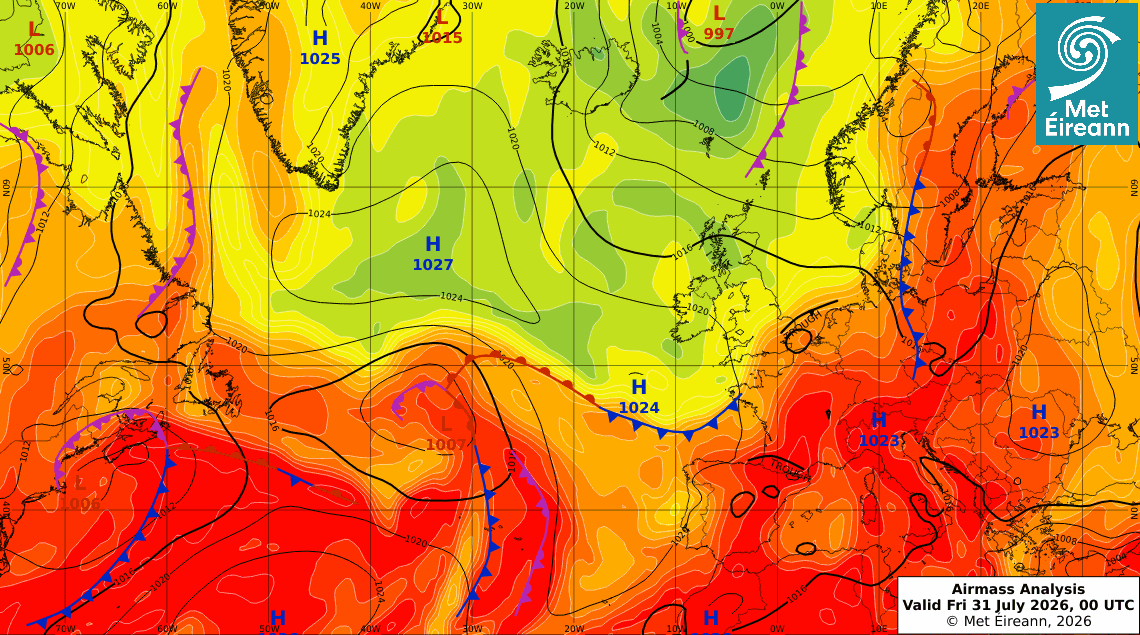
Airmass Analysis (850hPa Wet Bulb Potential temperature, Surface Pressure & Fronts) at 00UTC Friday 31 July 2026

These analysis charts show the surface pressure pattern over the North Atlantic and Europe at 00UTC today. They display isobars (lines of equal pressure) and indicate areas of high (H) and low pressure (L) along with their central pressure value. Isobars are represented by solid black lines every 4 hPa with the thicker isobars every 16 hPa. High pressure is usually associated with mainly dry, settled weather with light winds while low pressure is normally associated with unsettled weather which is often wet and windy. The lower the pressure generally the stronger the winds and the heavier the rain (a hurricane being the most extreme example). Fronts are the boundary between different airmasses; a cold front is blue, a warm front is red and an occlusion is purple. Climate of Ireland
The 850hPa wet-bulb potential temperature maps give meteorologists an idea as to where the boundaries between warm and cold air-masses are in the lower atmosphere. (850hPa = around 1.5km above sea-level)