What We Do
As Ireland’s National Meteorological Service, Met Éireann is tasked with monitoring, analysing and predicting Ireland’s weather and climate.
What Are Climate Services?
Climate services, provided by Met Éireann, are focused on the timely production and provision of high quality data (observational data, gridded data, scientific analysis, etc) and products to decision makers. In order to support Irish society at large and facilitate the development and evaluation of adaptation and mitigation strategies for Ireland.
Observations
Met Éireann operates the national synoptic, climate and rainfall observing systems. All climate science is based on high quality observational data. Met Éireann operates the national observational network to World Meteorological Standards, the data is quality controlled and securely stored in the national climate archive.
Analysis
The data, once quality controlled is available for analysis. This analysis defines the climate of Ireland, for example, Long Term Average values are produced against which current observational observations can be compared. A range of products are generated from the analysed data. Statements are published for each monthly, season and year, gridded data sets are generated for rainfall and temperature. Specific products are generated, for example, for users in the agricultural and engineering sectors.
Reanalysis
Met Éireann is involved in global climate modelling through its participation in the EC-Earth consortium, and downscaling of global models to a regional level through partnerships and collaboration with the EPA, universities and the Irish Centre for High End Computing (ICHEC). A high resolution reanalysis of Ireland’s climate since 1961, MÉRA, has also been completed.
Data
Met Éireann is committed to an Open Data policy, a wide range of data is available to download under an open license, from observations to grids to reanalysis. The range of data available is continuously expanding and tools are being developed to enable improved future access. Data not available online may be obtained by contacting us directly.
Agri-Meteorological Data
Click here for Latest Farming Commentary.
Soil Moisture Deficits, Evaporation, Potential Evapotranspiration, Actual Evapotranspiration and Runoff:
- Soil Moisture Deficit (SMD) is the amount of rain needed to bring the soil moisture content back to field capacity.
- Field capacity (SMD=0) is the amount of water the soil can hold against gravity i.e. the maximum water a pot plant can be watered and not leak water. Negative SMD indicates a water surplus, which will be drained over time through either infiltration or overland flow or both.
- Saturation is reached when SMD= -10mm, i.e a water surplus of 10mm. Positive SMD is below field capacity and rain can infiltrate to the capacity of the SMD amount. In a saturated soil all of the available soil pores are full of water, but water will drain out of large pores under the force of gravity.
- Evaporation is the rate of water loss from a free water surface such as a reservoir, lake, pool, or saturated soil. A Class A Pan is used for measuring evaporation. This is a circular tank 1.21 m in diameter and 0.25m deep, partly filled with water and mounted on a frame to allow free circulation of air underneath. Additional water is required to maintain a set level.
- Evapotranspiration is the total water flux into the atmosphere, i.e. the sum of evaporation and transpiration (water flux through plant stomata).
- Potential (or Reference) Evapotranspiration (PE) is the water flux under non-limiting soil water conditions. A lysimeter is used to measure the rate of potential evapotranspiration from grass. It consists of four sunken tanks, each some 0.25m sq. in area and 0.75m in depth. The soil surface in each tank is at the same level as the surroundings. Grass cover is maintained on the tanks. Measured Potential Evapotranspiration is recorded at Johnstown Castle, Co. Wexford and Valentia Observatory, Co.Kerry. In Met Éireann the FAO Penman-Monteith formula is used to calculate the daily Potential (Reference) Evapotranspiration, using meteorological data recorded at our Synoptic Stations.
- Actual Evapotranspiration (AE) is the water flux which actually occurs. This is limited by the amount of moisture available in the soil. Estimates of Actual Evapotranspiration are derived from calculated values of Potential Evapotranspiration and current SMDs.
Soil Moisture Deficit Model
A hybrid SMD Model* has been developed which accounts for differences in drainage regimes between different soil types in Ireland. Three soil drainage classes, well drained, moderately drained and poorly drained, are defined as follows:
- Drainage is the amount of water lost from the topsoil through either percolation or overland flow and is dependent on the soil drainage capacity.
- Well Drained: Soil never saturates, remains at field capacity even on very wet days in winter. Minimum SMD=zero. When SMD > 0mm AE is less than PE, decreasing linearly to zero when SMD is at a theoretical Maximum of 110mm.
- Moderately Drained: May saturate on wet winter days, but return to Field Capacity on first dry day. Minimum SMD= minus10mm. When SMD >0 AE is less than PE, decreasing linearly to zero when SMD is at a theoretical Maximum of 110mm.
- Poorly Drained: Saturates on wet winter days, water surplus is drained at very slow rates, in the order of 0.5mm per day. Minimum SMD= minus 10mm. When SMD >10mm AE is less than PE, decreasing linearly to zero when SMD is at a theoretical Maximum of 110mm
Daily Soil Moisture Deficits and calculated PE and AE are available for the three different soil drainage classes for our Synoptic Stations. Soil moisture deficits and surpluses are computed from the differences between rainfall and actual evapotranspiration. Soil moisture surpluses are assumed to be removed by drainage and surface run-off over time.
Potential (Reference) Evapotranspiration Calculation
The potential evapotranspiration, ET0 is calculated according to the FAO Penman-Monteith Equation (Allen et al., 1998) for a reference grass crop at an assumed height of 0.12m :

where ET0 is the potential evapotranspiration (mm d-1),
Rn is the net radiation at the crop surface (MJ m-2 d-1),
G is the ground heat flux density (MJ m-2 d-1),
T is the air temperature at 2 m height (°C),
u2 is the wind speed at 2 m height (m s-1),
es and ea are the saturation vapour pressure and the actual vapour pressure, respectively (kPa),
Δ is the slope of the vapour pressure curve (kPa °C-1),
and γ is the psychrometric constant (kPa °C-1).
Soil Moisture Deficit Calculation
The Soil Moisture Deficit (SMD)is calculated as follows:

where SMDt and SMDt-1 are the SMDs on day t and day t-1 respectively (mm),
Rain is the daily precipitation (mm d-1),
ETa the daily actual evapotranspiration (mm d-1),
Drain the amount of water drained daily by percolation and/or overland flow (mm d-1)
Actual Evapotranspiration
For each soil drainage class a critical Soil Moisture Deficit, SMDc, is defined. When the current SMD is less than this critical value then moisture is not limiting respiration and Actual Evapotranspiration equals to Potential Evapotranspiration:
When SMD <= SMDc

When the current SMD is greater than this critical value, moisture available is no longer unlimiting; as a result, Actual Evapotranspiration is less than Potential Evapotranspiration. In this case it is assumed that AE deceases linearly to zero as the SMD approaches a theoretical maximum value, SMDmax.
When SMD > SMDc
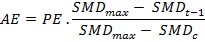
The value of SMDc for well and moderately drained soils is zero, and 10mm for poorly drained soils. The value of SMDmax is 110mm for all three soil types.
Drainage
It is assumed that drainage by means of percolation or overland flow only occurs when soil moisture exceeds field capacity (SMD < zero).
- Well Drained soils: These remain at field capacity even on very wet days and are never saturated, all water in excess of field capacity is drained immediately.
- Moderately Drained Soils: These carry water surpluses on wet days but return to field capacity on the first subsequent dry day. This corresponds to a maximum drainage rate in excess of 10mm/day.
- Poorly Drained Soil: These can carry surplus water for a number of days, water drains at the maximum rate of 0.5mm/day when SMD is -10, decreasing linearly to zero when SMD > zero
Effective Drainage is the total drainage amount, i.e. through percolation and overland flow.
The Agricultural Meteorology Unit page is here.
*References
- Allen, R.G., Pereira, L.S., Raes, D. and Smith, M. 1998. Crop evapotranspiration. Guidelines for computing crop water requirements. FAO irrigation and drainage paper 56, 227 pages.
- R.P.O.Schulte, J.Diamond, K.Finkele, N.M.Holden and A.J.Brereton 2005. Predicting the Soil Moisture Conditions of Irish Grasslands. Irish Journal of Agricultural Research 44: 95-110.
Legal Reports
A new legal weather report portal is now available to request legal weather reports.
Charges for the supply of climatological information
The following charges for the supply of climatological data and reports apply from Jan 2017 until further notice:
1. Basic Data
Historical climate data sets are now freely available on our website. Applications for free access to climate data not available on our website may be made under the Information on the Environment Regulations (AIE), turnaround time is usually two to four weeks.
| Data automatically sent on a daily basis: | €250 + vat per year |
|---|---|
| Data automatically sent on a weekly basis: | €210 + vat per year |
| Data automatically sent on a monthly basis: | €150 + vat per year |
An overall minimum charge of €45 + vat applies for urgent requests i.e. supplied within three working days.
2. Analysed Data
Analysed data/reports are prepared and issued by different meteorological grades and charged for at the appropriate hourly/daily rates (detailed below).
An overall minimum charge of €45 + vat applies.
3. Weather Reports
Weather reports are prepared and issued by different meteorological grades and charged for at the appropriate hourly rate. Legal reports are produced by a Meteorologist. Customers requesting priority treatment are charged 50% extra. The minimum charge for a weather report is the hourly rate for the relevant grade.
The following charges apply:
Hourly rates:
| Meteorological Officer: | €55 + 23% VAT (€12.65) = €67.65 |
|---|---|
| Senior Meteorological Officer: | €65 + 23% VAT (€14.95) = €79.95 |
| Principal Meteorological Officer / Meteorologist: | €90 + 23% VAT (€20.70) = €110.70 |
| Senior Meteorologist: | €110 + 23% VAT (€25.30) = €135.30 |
Daily rates:
| Meteorological Officer: | €385 + 23% VAT (€88.55) = €473.55 |
|---|---|
| Senior Meteorological Officer: | €455 + 23% VAT (€104.65) = €559.65 |
| Principal Meteorological Officer / Meteorologist: | €630 + 23% VAT (€144.90) = €774.90 |
| Senior Meteorologist: | €770 + 23% VAT (€177.10) = €947.10 |
In cases where daily rates are appropriate, such as court attendance or site survey, travel and subsistence charges also apply. The minimum charge is for half a day. A standby charge of 50% of the daily rate applies where staff may be required to be available to be called to attend court.
Note: Finance Act 2010 and Value Added Tax
In accordance with Section 117 of the Finance Act 2010, from 1st July 2010 public bodies engaged in VAT-able activities will be obliged to register and account for VAT. Accordingly from 1st July 2010, invoices issued by Met Éireann for climatological data and services delivered after that date will include VAT at the higher rate.
Public Works Contract Data
Weather Events in Public Works Contracts
An objective and measurable approach was adopted in relation to what is considered to be a weather event which could trigger a delay event, i.e. the contractor gets additional time. A delay event is triggered when a weather event exceeds a defined threshold (90th percentile) value in any given month.
Weather events are:
- Number of days per month with a rainfall amount > 10mm.
- Number of days per month with a maximum 10-min. mean wind speed >=15m/s.
- Number of days per month with a minimum temperature < 0 deg. C.
Monthly Weather Data
Monthly weather events for our Synoptic stations are available online, simply select a station from the map via the link below. To view the Weather Events for Public Works Contracts data, select a station first, then click the link just below the map.
The Department of Finance document describes how weather events are calculated and the historical data used to determine entitlement to an extension of time. Threshold values (90th percentiles) are detailed in this document.
The 90th percentile is the lowest value which has 90% of the sample data less than or equal to it. All available data for each station was used in its calculation. A station was not used unless there were at least 10 years of data available in the last 12 years for each calendar month.
Rainfall Return Period
A new rainfall return period application has been developed to replace the form based email service.
Please contact us at enq@met.ie if you experience any problems.
Monthly Rainfall and Temperature Grids
Monthly Rainfall and Temperature Grids are available here
30-Year Climate Averages
The 30-Year Climate Averages page is available here