The first ozone measurement was made at Valentia in 1926. After the discovery of the Ozone ‘holes’ over the poles in the nineteen eighties and in response to the need to quantify the depletion of ozone levels, Valentia Observatory has been conducting ground level, total column and stratospheric Ozone measurements since 1993, providing continuous data of over 20 years.
What is Ozone?
Ozone is a special form of oxygen with the chemical formula O3. The oxygen we breathe and that is so vital to life on earth is O2. Ozone constitutes a very small part of our atmosphere, but its presence is nevertheless vital to human well-being. Most ozone resides high up in the atmosphere, between 10 and 40km above Earth’s surface. This region is called the stratosphere and it contains about 90% of all the ozone in the atmosphere.
How does Ozone protect us?
Ozone in the stratosphere absorbs some of the Sun’s biologically harmful ultraviolet radiation. Because of this beneficial role, stratospheric ozone is considered “good” ozone. In contrast, excess ozone at Earth’s surface that is formed from pollutants is considered “bad” ozone because it can be harmful to humans, plants, and animals. The ozone that occurs naturally near the surface and in the lower atmosphere is also beneficial because ozone helps remove pollutants from the atmosphere.
Ozone Measuring Equipment in Valentia
Brewer spectrophotometer
The Brewer Spectrophotometer is a scientific instrument which measures Ultra Violet, or Visible, radiation in the solar spectrum. By examining the differential absorption of select wavelengths in the UVB portion of the spectrum, determinations of Total Column Ozone and Total Column Sulphur Dioxide are inferred.
Ozone Measurements and Data Distribution
Ground level ozone (GLO) is continuously monitored and is sent in real time to the Environmental Protection Agency (EPA) who manage the national ambient air quality monitoring network. If ozone levels were to rise above 90 ppb the EPA would issue a health warning to the general public.
Total column ozone data measurements are submitted daily to the WMO Northern Hemisphere Ozone Mapping Centre which provides near-real time total ozone and departure maps and is operated and hosted by the Laboratory of Atmospheric Physics at The Aristotle University, of Thessaloniki, Greece.
Ozonesonde are ‘balloons’ that measure stratospheric ozone amounts. They are launched monthly from May to November and on weekly basis from December to April.
Ozone Data Products
The average ground ozone level at Valentia Observatory is 35ppb however, the data tends to be reported in units of micrograms per cubic metre (µg/m3), which as a rough approximation is simply double the ppb value.
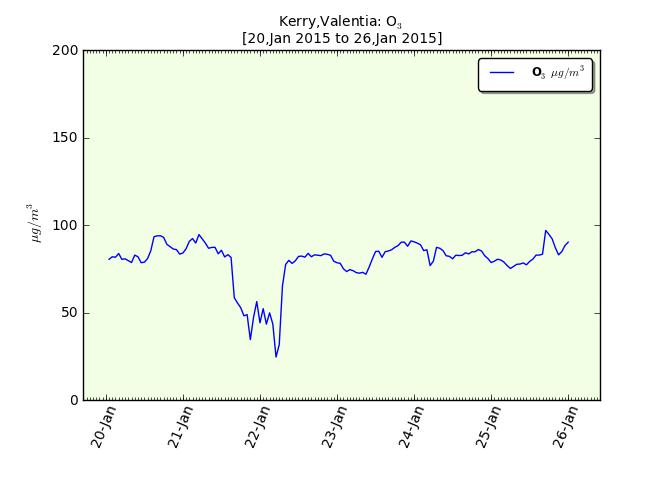
Full ground Ozone
Full ground ozone data for one week at Valentia
Generally a ‘clean site’ would tend to have ozone levels of approximately 20 – 45 ppb, with levels at the other extreme of over 300ppb having been found in Mexico City. Actual acceptable levels of ozone in Europe is governed by legislation, in particular the EC Directive 2008/50/EC, which states that the maximum daily 8-hour mean must not exceed 120µg/m3 more than 25 days per calendar year over 3 years.
The directive also sets the levels at which citizens should be both informed and alerted, 180µg/m3 and 240µg/m3 respectively, to the dangers of ground ozone. Finally it sets a long term objective that ground ozone levels, by 2020, should always have a maximum daily mean of less than 120µg/m3. As most of the populace would be unfamiliar with these values the status of the current air quality is generally reported in descriptive terms, such as good, fair, poor, etc. This is termed the ‘Air Quality Index’ and is determined from the actual current ground ozone level and the use of the table shown below.
| Air Quality Index O3 in: | µg/m3 (1 hour average) | ppb (1 hour average) |
|---|---|---|
| Very Good | 0 – 39 | 0 – 19 |
| Good | 40 – 119 | 20 – 59 |
| Fair | 120 – 179 | 60 – 89 |
| Poor | 180 – 239 | 90 – 119 |
| Very Poor | ≥ 240 | ≥ 120 |
Table: Air Quality Index