In the podcast we mention the ‘Keeling curve’ which is a graphic showing carbon dioxide concentration in the atmosphere, measured since 1958.
See an image of the Keeling curve below.
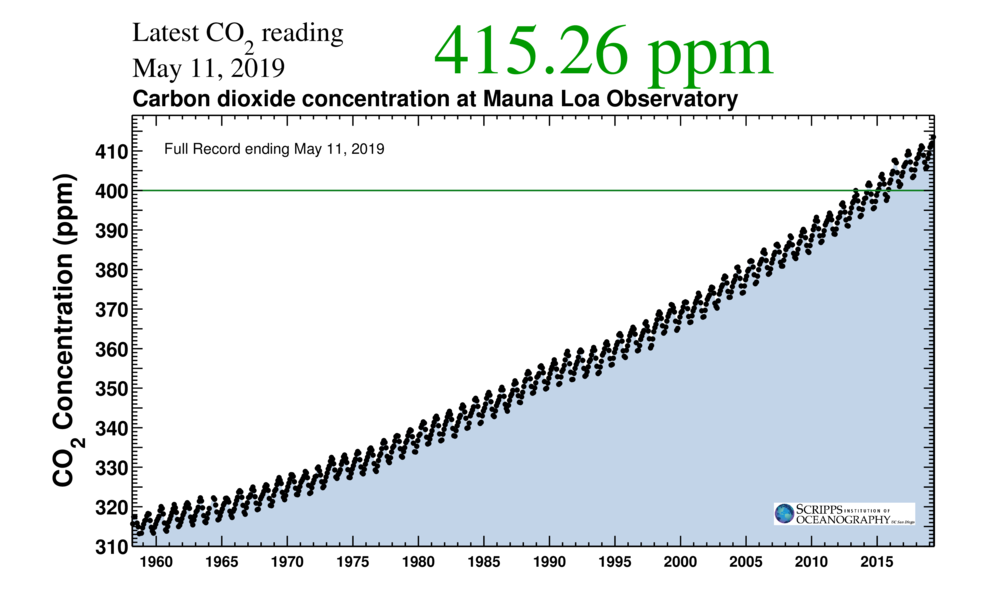
Keeling curve
Atmospheric carbon dioxide concentrations taken from the ice core record over the past 800,000 are shown here:
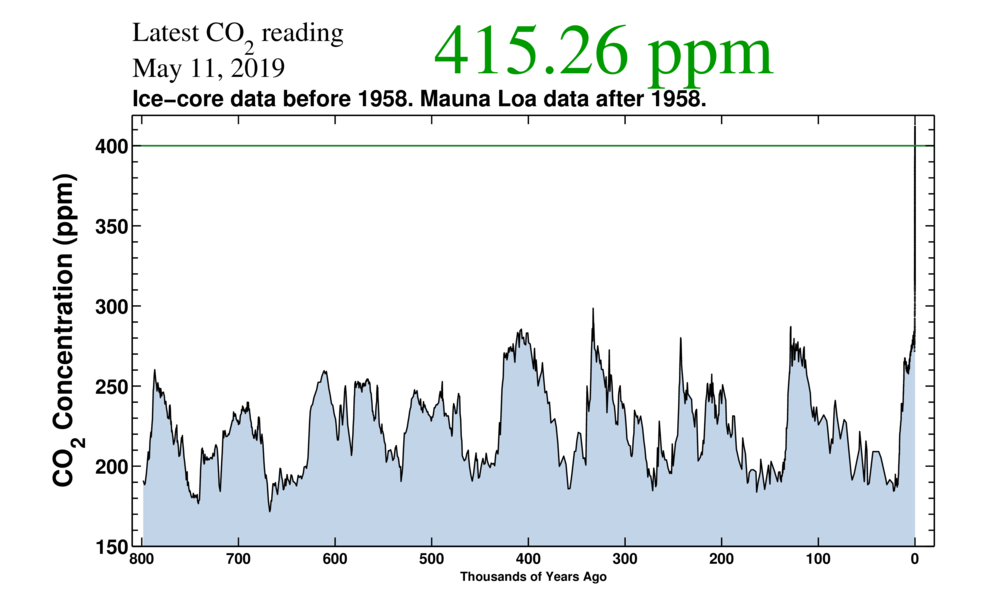
Note the almost vertical spike in CO2 concentrations in the past century.
Both these images were sourced from https://scripps.ucsd.edu/programs/keelingcurve/
Further reading on the topics discussed in this episode can be found on the IPCC website and via the work of Irish Climate Scientist Paul Nolan.
IPCC (The Intergovernmental Panel on Climate Change): https://www.ipcc.ch/
Paul Nolan’s Report: