In advance of Earth Day 2023, Met Éireann, in a joint initiative with the Department of Housing, Local Government and Heritage’s building standards team, has unveiled climate maps and design weather files in a series of new research reports which will guide the design and construction of Irish building projects into the future.
This project, called Climate maps and data to support building design standards, was carried out in support of Ireland’s Climate Action Plans 2021 and 2023 as part of Actions 203 and BE/23/36 – Develop specific climate maps and data for use in building design to enhance resilience in support of climate change adaptation, respectively, and to underpin the National Adaptation Framework, in order to reduce the vulnerability of the country to the negative effects of climate change.
As part of this project and based on official international methods, Met Éireann has produced new reports which utilise the driving rain index, an important climatological consideration when designing buildings, and maps extremes in temperature, soil temperature, snow loadings and rainfall frequencies.
Climate data for use in building design consisting of past and future weather files for overheating risk assessment are also presented.
The outputs of this analysis can be used in numerous ways to inform public policy and to future-proof investment, particularly relating to the built environment – such as the building of bridges, roadways and buildings, to ensure Irish buildings and infrastructures remain climate resilient over their full design life.
The project delivered six new climate service products to assist Ireland built environment.
Driving rain index
Wind-driven rain against a wall may be partially absorbed or penetrate through cracks in the wall, therefore increasing the risk of damage to the building fabric. Rain penetration through gaps and cracks in building façades and around the edges of doors and windows usually occurs after short periods of heavy rainfall accompanied by winds. The impacts of rain on buildings depend on the rain intensity, duration, wind speed and wind direction.
For the first time, enhanced driving rain intensity indices were produced employing a new methodology[1]. The resulting map of driving rain can support Irish decision makers on the best material and construction methods to use in different parts of the country.
[1] based on I.S. EN ISO 15927-3:2009 Hydrothermal performance of buildings – calculation and presentation of climatic data – part 3: calculation of a driving rain index for vertical surfaces from hourly wind and rain data.
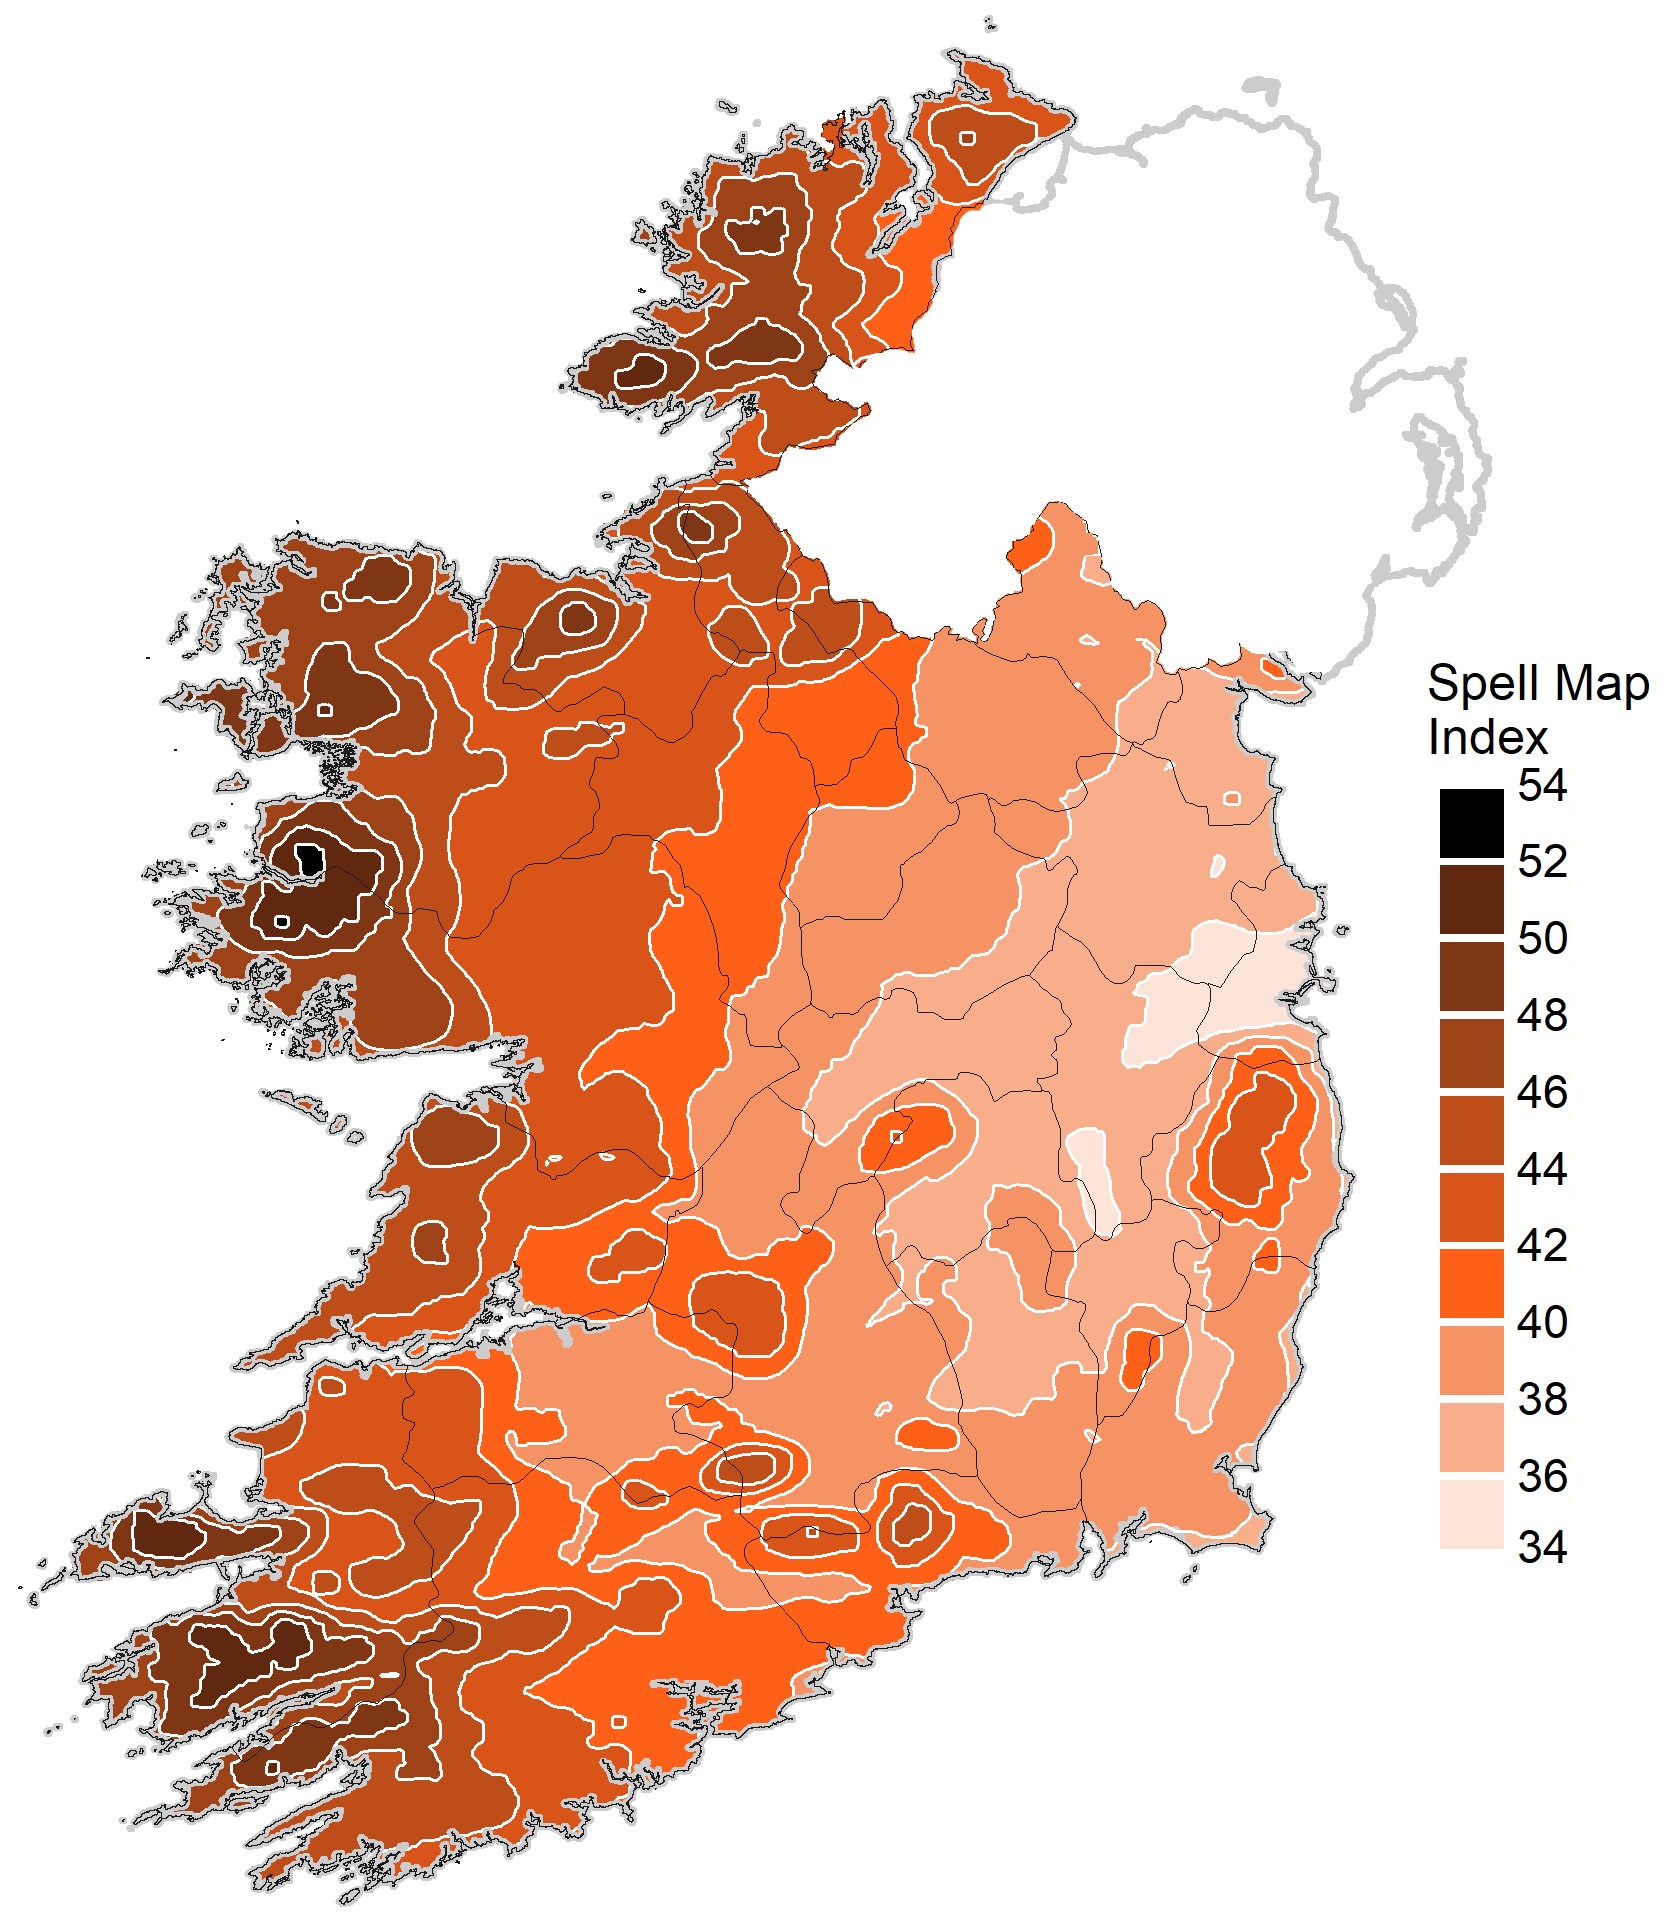
Spell map index (mS) of driving rain against vertical surfaces for the period 1991 – 2020 for Ireland (I.S. EN ISO 15927 32009).
Maximum and minimum temperature return periods
These new temperature return period maps are an update of previous maps but were developed on the very latest observations, over a longer period of time and from more locations.
The new return periods can inform policy in delivering key national infrastructures such as housing and building renovation and the design of roads and bridges.
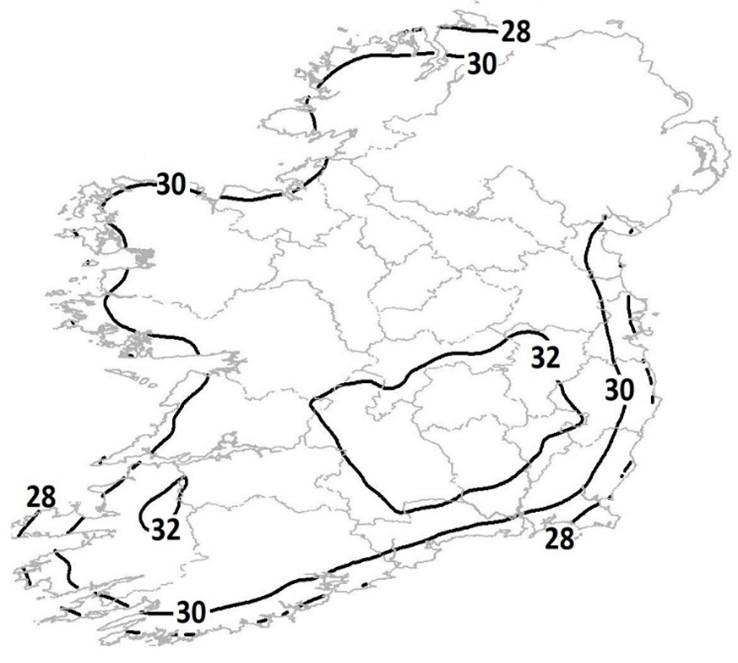
Figure 2: 50-year return period of highest maximum shade air temperature (°C) at mean sea level in Ireland
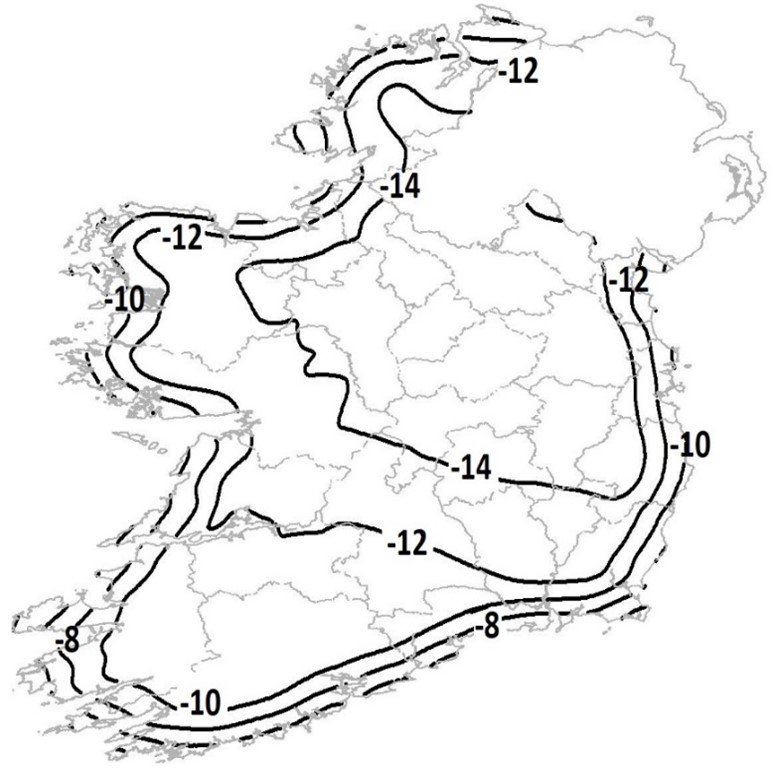
Figure 3: 50-year return period of lowest minimum shade air temperature (°C) at mean sea level in Ireland.
Estimation of rainfall intensities for various return periods and durations
In Ireland, short-duration and intense localised rainfall events can lead to severe flooding. In upland areas, heavy rainfall events are associated with slope instability, erosion, landslides, sediment transport, destabilisation of masses of peat and flooding. Runoff events associated with rainfall extremes often result in flash flooding, particularly in small drainage basins with short concentration times and rapid response catchments. Such events present a significant risk to human life and infrastructure, especially in densely populated urban settings.
The goal of this product was to calculate return values of rainfall amounts for various return periods, ranging from 2 to 120 years, for specific rainfall durations ranging from 15 minutes to 25 days based on a denser network of stations with up-to-date data and according to the depth-duration-frequency model. These outputs are an update of the work produced in 2007 and with more up-to-date data.
Guidance to allow rainfall amounts in durations down to 2 minutes to be estimated is provided.
These products have diverse applications, such as informing the design criteria for drainage schemes, sewerage systems, bridges, gutters, and fluvial flood mitigation measures.
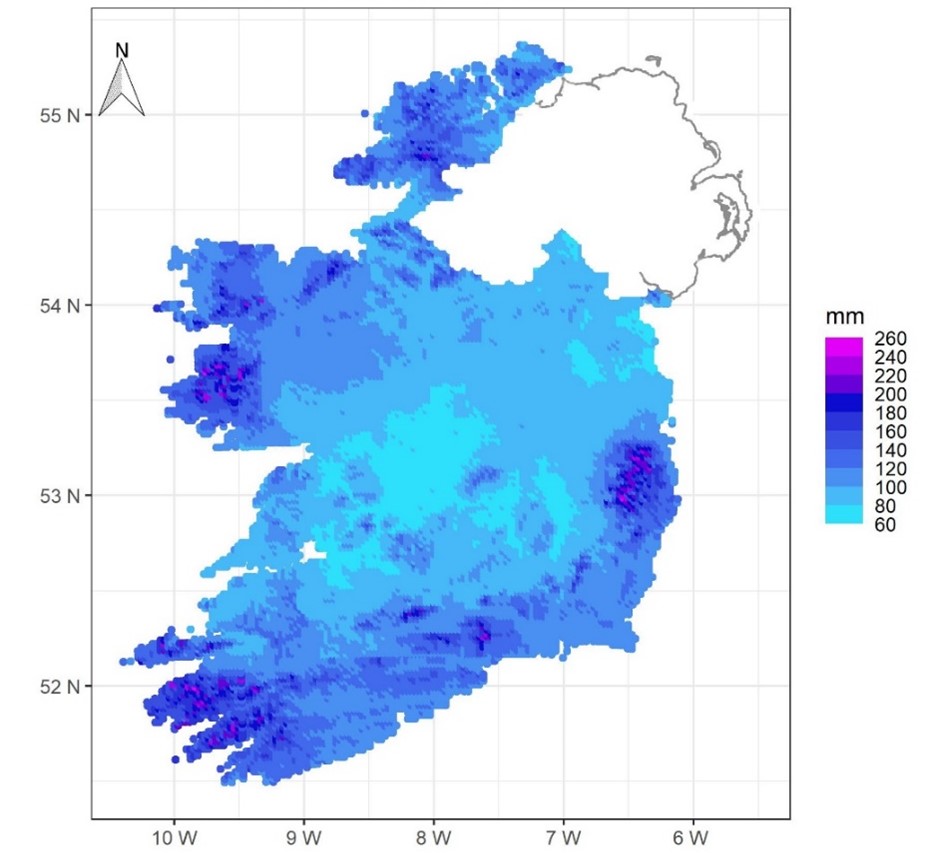
Figure 4: Return value for a 120-year return period for rainfall depths of 1-day duration in Ireland.
Return period maps of soil temperatures
For the first time, return values of the lowest 10 cm soil temperature were calculated based on the generalised extreme value distribution were produced to support the structural design of buildings in Ireland.
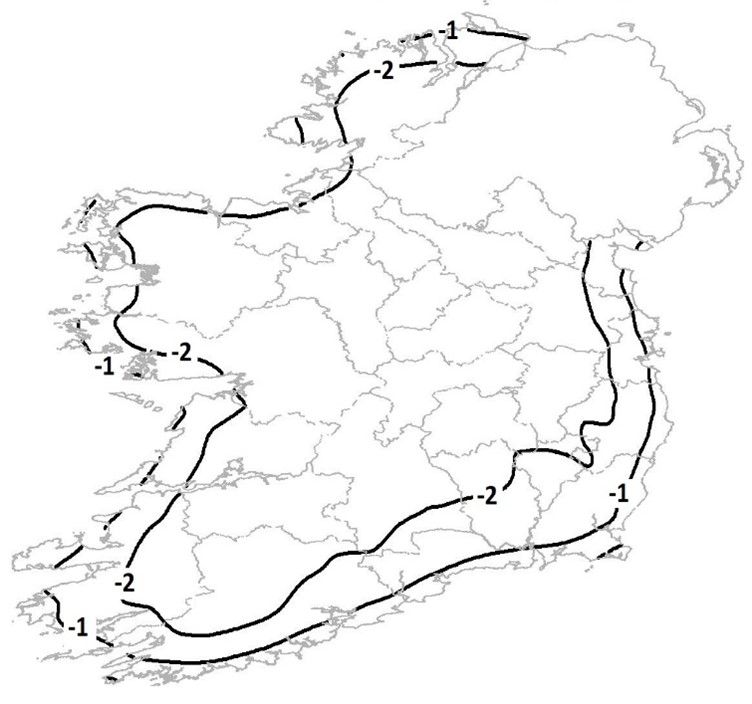
Figure 5: 120-year return period of the lowest 10cm soil temperature (°C) for Ireland.
Maps of snow loads
Snow loading is the force on a surface due to the depth of accumulated snow and is important to inform the structural design of buildings and civil engineering works, for example, the design of roof tiling patterns or roof supporting structures. The new snow load maps are an update of the work produced in 2010 with more robust gridding and more up-to-date data.
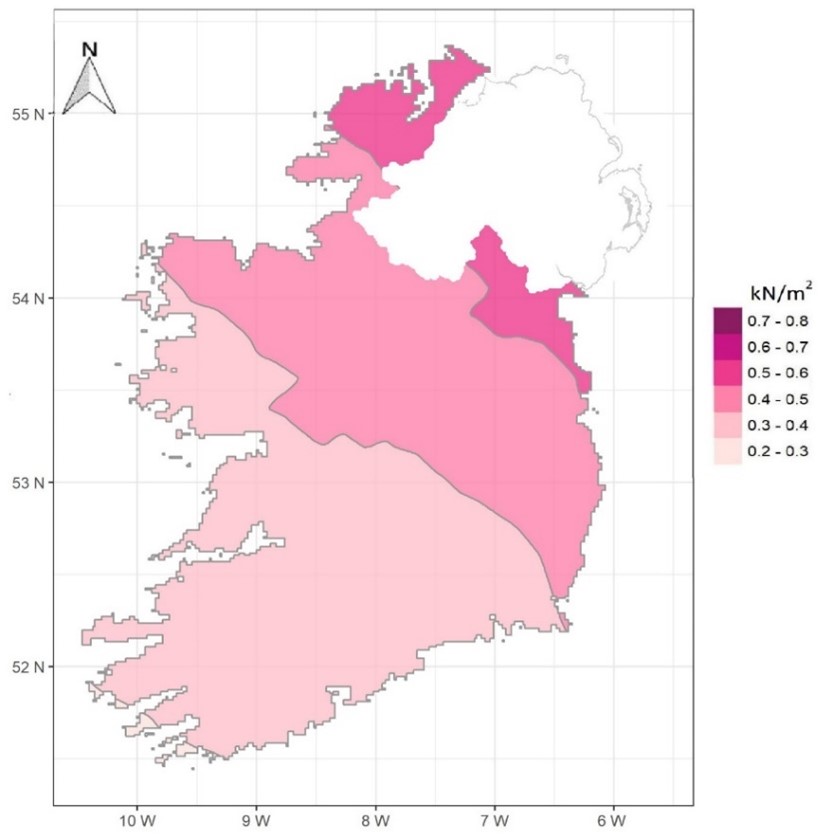
Figure 6: Return values of snow loadings at 100m above mean sea level in Ireland for a 50-year return period.
Building design weather files for overheating risk assessment
The weather files have been generated at six locations. These files come in the form of a Test Reference Year (average conditions) and Design Summer Years (overheating events) for both past weather conditions and a range of future climate scenarios. These data provide freely accessible localised information for building designers for the thermal modelling of buildings that were not previously available, enabling the assessment of overheating risks for buildings in Ireland more accurately.
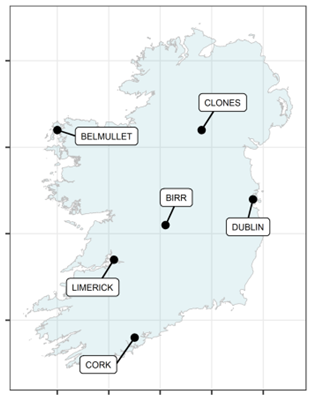
Figure 7: Map with the six locations of the new weather files.
The project was completed in consultation with a steering group made up of representatives from the National Standards Authority of Ireland, Sustainable Energy Authority of Ireland and members of the Department’s Building Standards committee under Climate Action Plan 2021.
This work showcases Met Éireann’s broader role in developing climate services to benefit wider society as part of its Strategic Plan ‘Making Ireland Weather and Climate Prepared’, which focuses on assisting Irish society to be ready for and responsive to weather and climate risks.
The Press Release on this project can be consulted on the Department of Housing, Local Government and Heritage[1] website. This announcement is made in advance of Earth Day 2023 on 22nd of April as this project enhances resilience in support of climate change adaptation and meets this year’s theme, ‘Invest in our Planet’.
Read more in the following project reports:
Griffin, S., Mateus, C., Lambkin, K. 2023. Climate data for use in building design – past and future weather files for overheating risk assessment. Climatological Note No. 21. Dublin: Met Éireann. http://hdl.handle.net/2262/102418
Mateus, C., and Coonan, B. 2023. Estimation of point rainfall frequencies in Ireland. Technical Note No. 68. Dublin: Met Éireann. http://hdl.handle.net/2262/102417
Mateus, C., and Coonan, B. 2022. Snow loadings at 100m above mean sea level for Ireland. Climatological Note No. 20. Dublin: Met Éireann. http://hdl.handle.net/2262/101583
Mateus, C., and Coonan, B. 2022. Isothermal maps of the lowest 10cm soil temperatures in Ireland. Climatological Note No. 19. Dublin: Met Éireann. http://hdl.handle.net/2262/101584
Mateus, C., and Coonan, B. 2022. Isothermal maps of maximum and minimum shade air temperatures in Ireland. Climatological Note No. 18. Dublin: Met Éireann. http://hdl.handle.net/2262/101585
Mateus, C., and Coonan, B. 2024. Distribution of driving rain in Ireland. Climatological Note No. 17. Dublin: Met Éireann. http://hdl.handle.net/2262/101280