Met.ie has redesigned its homepage with extra forecast information and a mobile-friendly design.
- You can still get an hourly weather forecast for the next 10 days for over 1500 locations on the island of Ireland, using the search box at the top of our website homepage or click the navy Met Éireann logo to return to the homepage.
- Met.ie can also generate a weather forecast for your location. When you enter the website first, a pop-up asks if you would like to ‘allow www.met.ie access your location’. This is an optional feature. If you allow it, an hourly forecast is generated for your location. Privacy.
- The hourly forecast now shows extra information such as % chance of rain, gust, feels like temperature, humidity and more.
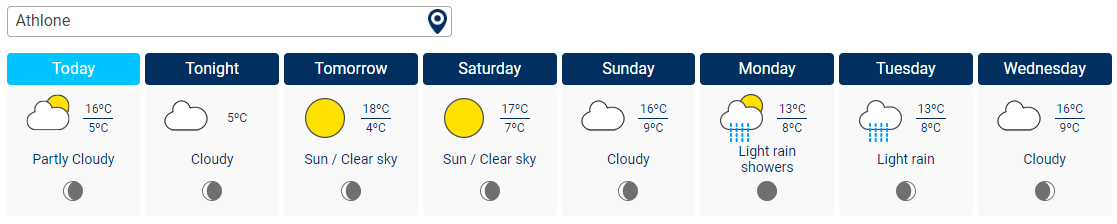
An example of the daily weather forecast panels at noon or 6pm today, midnight and noon (UTC) for the next 6 days.
The daily Outlook panels show the type of weather, forecast at one particular hour – it is not a summary of the weather for that day.
The symbol shows the weather at: noon Today, 6pm Evening, midnight Tonight and then at noon (UTC) for the next 6 days.
The Outlook also shows the maximum and minimum temperature each day from 0900 to 0900 next day (UTC). The maximum temperature is the highest temperature between 0900 – 2100 (UTC), the minimum is the lowest temperature from 2100 – 0900 (UTC) the next day. Moon phase is available on the desktop version of our website – hover over the symbol to read the phase name. Tap each day to show the hourly forecast for that day.
The outlook and the hourly weather forecast should be viewed as a guideline only, please consult the National/Regional forecast also.
The Hourly Weather Forecast
The hourly weather forecast displays post-processed data from HARMONIE-AROME and ECMWF Numerical Weather Prediction models in Irish local time. Sunrise, sunset and moonphase is provided by MET Norway, see data sources. Use the ‘Show Full Forecast’ option to expand the forecast.
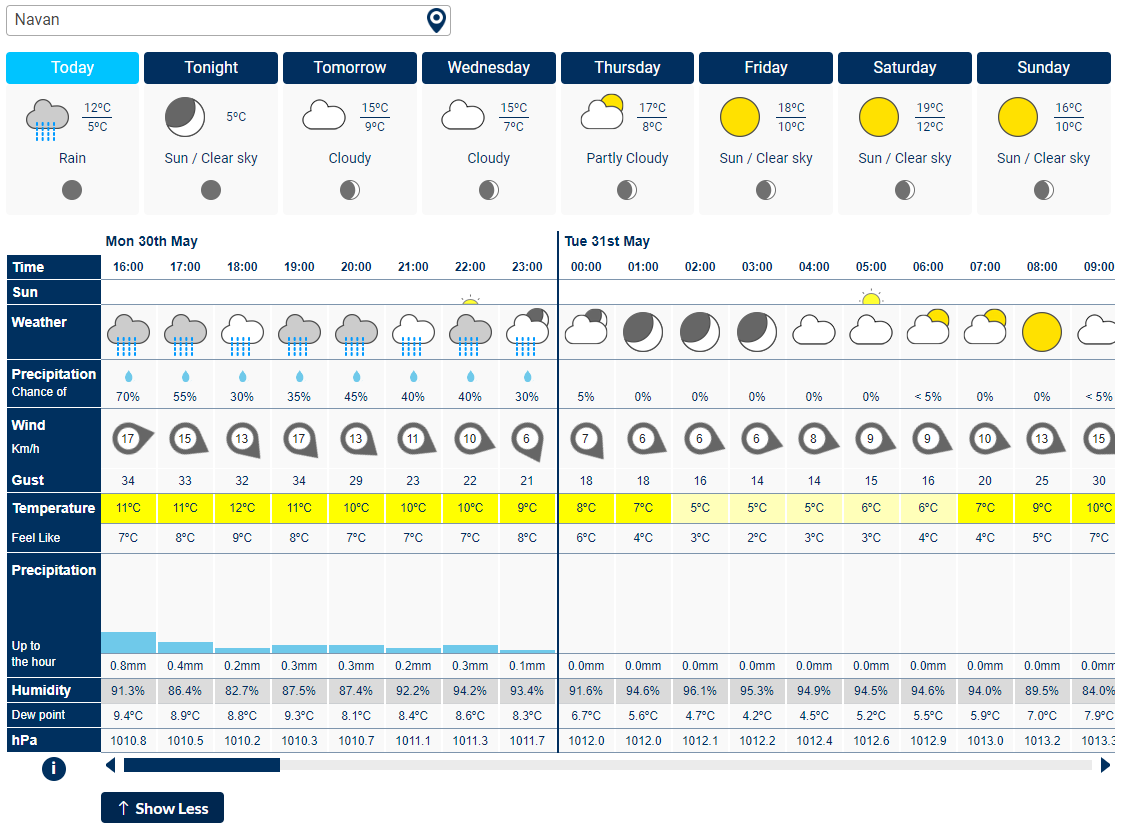
Example of our new hourly forecast design
The time shown is Irish local time. Irish summer time or GMT depending on daylight savings time dates.
The hour in which there will be sunrise and sunset, rounded up or down.
The Weather symbol is the type of weather forecast during the preceding hour(s). It is deduced from different weather parameters. Hover over it on desktop to display the text meaning. See also our FAQ with weather symbol descriptions
Any weather warnings for that location will be displayed here when issued – the warning icon will be linked to our weather warnings page
% Chance of Precipitation (rain, sleet or snow). This forecasts the percentage chance that there will be 0.2mm or more of total precipitation during the preceding hour. This forecast is available hourly only. Raindrops represent the Precipitation (mm) value in the expanded view. 1 raindrop = >0.1mm, 2 drops = >1.0mm, 3 drops = >2.0mm.
Mean wind speed and direction, Gust (both km/h) values are forecast for the top of the hour indicated. The tip of the wind pointer indicates the direction in which the wind is forecast to blow. The Gust is the highest wind speed value forecasted during the preceding hour.
Air temperature °C and Feels Like temperature (°C) are forecast for the top of the hour. Feels Like temperature is calculated from air temperature, relative humidity and wind speed. It is the temperature equivalent perceived by people and is described in detail below. Temperature values are rounded to whole numbers. Minus zero (-0 °C) temperatures indicate values between 0°C (zero) and -0.5°C.
Precipitation can be rain, sleet or snow. The value shows the accumulated amount up to that hour, i.e. in the previous hour(s). For example, in the example above the rainfall forecast is 0.4mm between 16:00 and 17:00. The value is the median value of all weather forecast ensemble members.
Humidity is % Relative Humidity, Dew Point is the temperature that the air-mass needs to reach in order to give a relative humidity of 100%, or saturation, further detail below. hPa is forecast MSLP (mean sea level pressure). Wind, gust, temperature, feels like temperature, humidity, dew point and hPa values are the forecast for the top of that hour.
This forecast is hourly for the next 3 days, then in 3 hourly intervals for 2 days and finally 6 hourly intervals, up to 10 days ahead.
How often is it updated?
A new hourly location forecast ‘meteogram’ is generated by the Harmonie-Arome model 4 times every day. The latest forecast data will be available on met.ie and on the Met Éireann app from about 9am, 3pm, 9pm and 3am for the hourly forecast data (up to 72 hours ahead). The remaining forecast up to 10 days ahead is provided by data and products of the European Centre for Medium-range Weather Forecasts (ECMWF) and is updated twice daily. The sunrise/ sunset and moonphase forecast is obtained from YR.no ‘Sunrise’ API. We call the data for 5 different vertical regions across Ireland, it is updated once per day.
The National Forecast is updated approximately 6 times per day, the Regional Forecasts are updated 3 times per day.
The forecast maps are generated by the Harmonie-Arome model 4 times every day. The latest forecast data will be available on met.ie and on the Met Éireann app from about 9am, 3pm, 9pm and 3am for the hourly forecast data (up to 48 hours ahead). The remaining forecast up to 10 days ahead is provided by data and products of the European Centre for Medium-range Weather Forecasts (ECMWF) and is updated twice daily.
We receive pollen forecast from © Dr. David O’Connor, School of Chemical Sciences, DCU. The UV Index forecast provider is Deutscher Wetterdienst (DWD). Both forecasts are received and updated once daily and both are also available as a daily text forecast on each Regional forecast section on this website and on our app.
If you would like to find out more about how the hourly forecasts are generated, listen to the Met Éireann Podcast episode ‘Chaos and Computing in Weather Forecasting’ on Spotify or wherever you listen to podcasts. Technical information is available on our website at Operational Numerical Weather Prediction.
Feels Like temperature
We often use the air temperature as an indicator of how comfortable is to be outside or do any outdoor physical activities. However, the air temperature is only one factor in the assessment of thermal stress. In climates where other important factors, mainly wind and humidity, can vary widely from day to day, we need more than just the temperature for a more realistic assessment of comfort.
It can be useful to condense all the extra effects into a single temperature value.
Met Éireann uses the Apparent temperature formula to calculate Feels Like temperature. Apparent temperature was developed in Australia (Robert Steadman, 1984) and is the temperature equivalent perceived by humans, caused by the combined effects of air temperature, relative humidity and wind speed.
Most other methods for calculating the “feels like” temperature only take into account the wind. The wind is by far the dominant element in cold conditions, this is called the wind-chill. For cold climates it is a significant parameter because of the danger of exposure to very low temperatures and strong winds.
What causes thermal stress?
Human thermal comfort depends on environmental and personal factors. The four environmental factors are airflow (wind), air temperature, air humidity, and radiation from the sun and nearby hot surfaces. The personal factors are the clothing being worn and the person’s level of physical activity. Thermal sensation is also significantly affected by acclimatisation/adaptation: people living in hot climates have been shown to be comfortable at higher temperatures than those living in cooler climates.
In colder conditions, the body must either reduce heat loss (e.g. by taking shelter from the wind) or increase heat production, for example, by greater physical activity. In these conditions evaporation and air humidity are relatively unimportant factors. The cooling of the exposed parts of the body by the wind now becomes the most important external factor affecting thermal balance.
In hotter conditions the body must shed heat to maintain thermal equilibrium. The cooling effect of evaporation of sweat from the skin becomes an important factor. The efficiency of this cooling depends on the humidity of the air. A high humidity reduces the effectiveness of evaporative cooling significantly. The amount of clothing will also affect this cooling efficiency due to its restriction of the air flow over the skin. Fabrics with low vapour permeability (those that don’t “breathe”) will increase the humidity of air near the skin.
Dew Point Temperature
The dew point temperature is a very important parameter used by Meteorologists’ when formulating weather forecasts. It can give the forecaster an idea of the type of air-mass covering the country and is a better indicator than simply using the surface air temperature when trying to determine the feel of the weather.
The dew point is the temperature that the air-mass needs to reach in order to give a relative humidity of 100% or saturation.
When relative humidity reaches 100%, the air can no longer hold more moisture in gas form and condensation occurs resulting in the creation of mist/fog or precipitation such as rain. The dew point therefore determines the ‘dryness’ or ‘moistness’ of the air-mass in a region. A low dew point indicates quite dry air whilst a high dew point indicates a moist air-mass. Low dew point temperatures are required in winter for snowfall whilst in summer high dew point temperatures often aid the development of heavy showers or thunderstorms.
Data Sources
The location weather forecast displays post-processed data from HARMONIE-AROME and ECMWF Numerical Weather Prediction models. Sunrise, sunset and moonphase data provided by MET Norway API Licence. The UV index forecast is provided by DWD, pollen forecast is provided by © Dr. David O’Connor, School of Chemical Sciences, DCU, forecast
Met Éireann Weather Forecast API Information