As climate change continues, global average Sea Surface Temperatures (SSTs) will continue to increase. This has significant consequences for marine ecosystems and can exacerbate extreme weather patterns. A warmer atmosphere can hold more moisture, about 7% for every 1°C of warming, and warmer waters in turn provide more energy for storms and can contribute to extreme rainfall events and cyclones. Recent extreme precipitation, thunderstorms and above average temperatures across Ireland could be linked to the elevated sea-surface temperatures and marine heatwave we have experienced in June 2023.
What are marine heatwaves?
Marine heatwaves (MHWs) are characterized by unusually warm water temperatures that persist for extended periods. The world’s oceans act as Earth’s great heat reservoir, and have absorbed over 90% of the excess heat trapped by greenhouse gas emissions. While this has slowed the rate of atmospheric warming, it has come at a cost: the intensification of MHWs. These extreme events can have devastating consequences, and can potentially cause widespread bleaching of coral reefs, the proliferation of harmful algal blooms, the displacement of marine species, and the disruption of entire food chains.
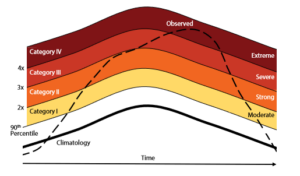
Figure 1: Description of Marine Heatwave categories (from Hobday et al., 2018). The solid black line represents the typical climatology expected in an area, while the dashed line represents a marine heatwave developing over time, going from moderate to extreme and back again.
Observed Data
A category 4 heatwave in parts of the north Atlantic off the coast of Ireland occurred in June 2023, with some hotspots hitting category 5, which describes conditions which are ‘beyond extreme’. The data in Figure 2 comes from NOAA and uses a mixture of satellite, ship and buoy observations since 1981. Data observed by the Marine Institute’s Irish Marine Data Buoy Observation Network (IMDBON) around Ireland have all recorded extreme sea-surface temperatures, with all buoys provisionally expected to break their June maximum temperature records.
Met Éireann climatologist Paul Moore states: “We are seeing sea surface temperatures around what we would get in August rather than June. The whole North Atlantic on our side is quite a bit above average in places. The current marine heatwave around Ireland is likely caused by a combination of natural variability and background warming due to climate change. Part of the natural variability is the synoptic setup between mid-May and mid-June, which saw high pressure over or to the north of Ireland dominating. This led to low wind and high solar radiation in a mostly easterly air flow during that period”
The water off Ireland’s southwest coast is at 17.4 °C, almost 4°C higher than the average June temperature. On the 19th June 2023 IMDBON buoys were showing provisional approximate mean temperatures of 14.5°C in the Irish Sea (M2 buoy), 17.4°C off Cork (M3 buoy), 17.1°C off Donegal (M4 buoy) and 16.9°C in the deep Atlantic (M6 buoy).
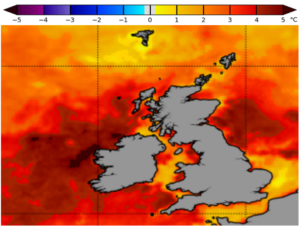
Figure 2: Daily 5km SST Anomalies (20th June 2023, NOAA)
Data from the M6 Buoy in Figure 3 below illustrates the conditions leading up to the marine heatwave off the west coast of Ireland, during this period there was very little wind due to high pressure to the north for the second half of May and first half of June, combined with a lot of sunshine to heat the water from the top. Typically, waves and a more disturbed sea surface mix cold water up from below and reduce the sea-surface temperatures, but this did not happen and sea-surface temperatures increased significantly.
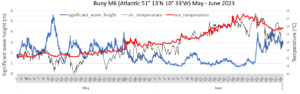
Figure 3: M6 buoy data showing calm seas with very little wave height coinciding with the increased sea-surface and air temperatures. As turbulence increased in the sea recently, the temperatures have began to drop again.
Figure 4 shows that global Sea Surface Temperatures (SSTs) are at their highest ever recorded and have persisted well above average all year. The temperatures in the past few months are significantly higher when compared to all previous years on record, since 1981.
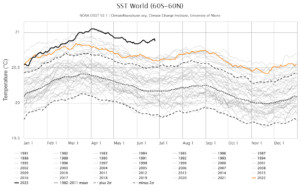
Figure 4: 2023 Global Sea-Surface Temperatures in context (NOAA – ClimateReanalyzer.org)
Future Projections
As global temperatures increase, sea surface temperatures will increase also. Climate change projections for MHWs, in published research here, indicate that their intensity will continue to increase by ~1.5°C for a mid-range climate scenario, and ~3°C for a worst-case scenario by 2100, compared with the 1961–1990 historical (Figure 5).
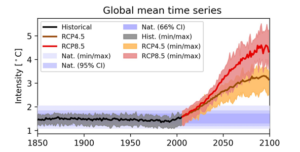
Figure 5: Global marine heatwave intensity modelled and projected (Oliver et al., 2019). Black and grey lines show modelled historical climate average and range, brown line indicates the RCP4.5 mid-range climate change scenario ensemble mean, with yellow shading representing model spread, red solid line represents the ensemble mean of the RCP8.5 scenario, with red shading representing model spread.
Projections also indicate that the number of days where a MHW occurs has been increasing and will continue to increase up to 2100; Figure 6 shows the annual count of MHW days has increased since 1850 (black line and grey shading), especially since 1980. In the worse-case scenario experiment (red line and shading) the entire globe is projected to approach a permanent MHW state by 2100. The medium-range scenario is projected to have around 300 days per year in a MHW (Figure 6). There are regional differences in the severity of the projections, but all areas of the planet are expected to have an increase in marine heatwaves.
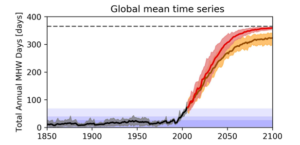
Figure 6: Total days per year of marine heatwaves, modelled and projected (Oliver et al., 2019). Black and grey lines show modelled historical climate average and range, brown line indicates the RCP4.5 mid-range climate change scenario ensemble mean, with yellow shading representing model spread, red solid line represents the ensemble mean of the RCP8.5 scenario, with red shading representing model spread. The dashed line indicates a world where marine heatwaves occur 365 days of the year.
Consequences of Marine Heatwaves
Consequences of MHWs are potentially wide-ranging, severe and irreversible. Impacts include:
- Ecological Disruption: Marine heatwaves can disrupt the delicate balance of marine ecosystems. They can cause mass bleaching of coral reefs, leading to their degradation and potential loss. Additionally, the increased water temperatures can trigger the proliferation of harmful algal blooms, which can harm or kill marine life and reduce water quality.
- Changes in Species Distribution: The warmer waters during a heatwave can cause shifts in the distribution of marine species. Some species may migrate to cooler areas, while others may struggle to adapt to the changing conditions. This can impact fisheries and the overall biodiversity of the region.
- Threats to Aquatic Life: Marine heatwaves can place stress on various marine organisms, including fish, shellfish, and other aquatic species. The elevated water temperatures can reduce oxygen levels and increase the risk of disease outbreaks, leading to fish kills and other population declines.
- Economic Impact: Coastal communities in Ireland heavily rely on fisheries and tourism related to marine activities. Marine heatwaves can disrupt fishing industries by affecting fish stocks, leading to economic losses for fishermen and related businesses. The negative impacts on coastal ecosystems and the aesthetics of beaches can deter tourists.
- Climate Feedback: Marine heatwaves can have implications beyond immediate impacts. They can contribute to a feedback loop in the climate system by releasing stored carbon dioxide and other greenhouse gases from the ocean, further exacerbating global warming and climate change.
The severe north Atlantic marine heatwave of June 2023 emphasises the importance of cutting global greenhouse gas emissions rapidly and permanently, to have a chance at avoiding the most catastrophic impacts of climate change. Temperatures at Met Éireann’s synoptic stations on land are also well above average and are likely to break mean temperature records for June. A report on these extreme temperatures will be released by Met Éireann over the next few days.