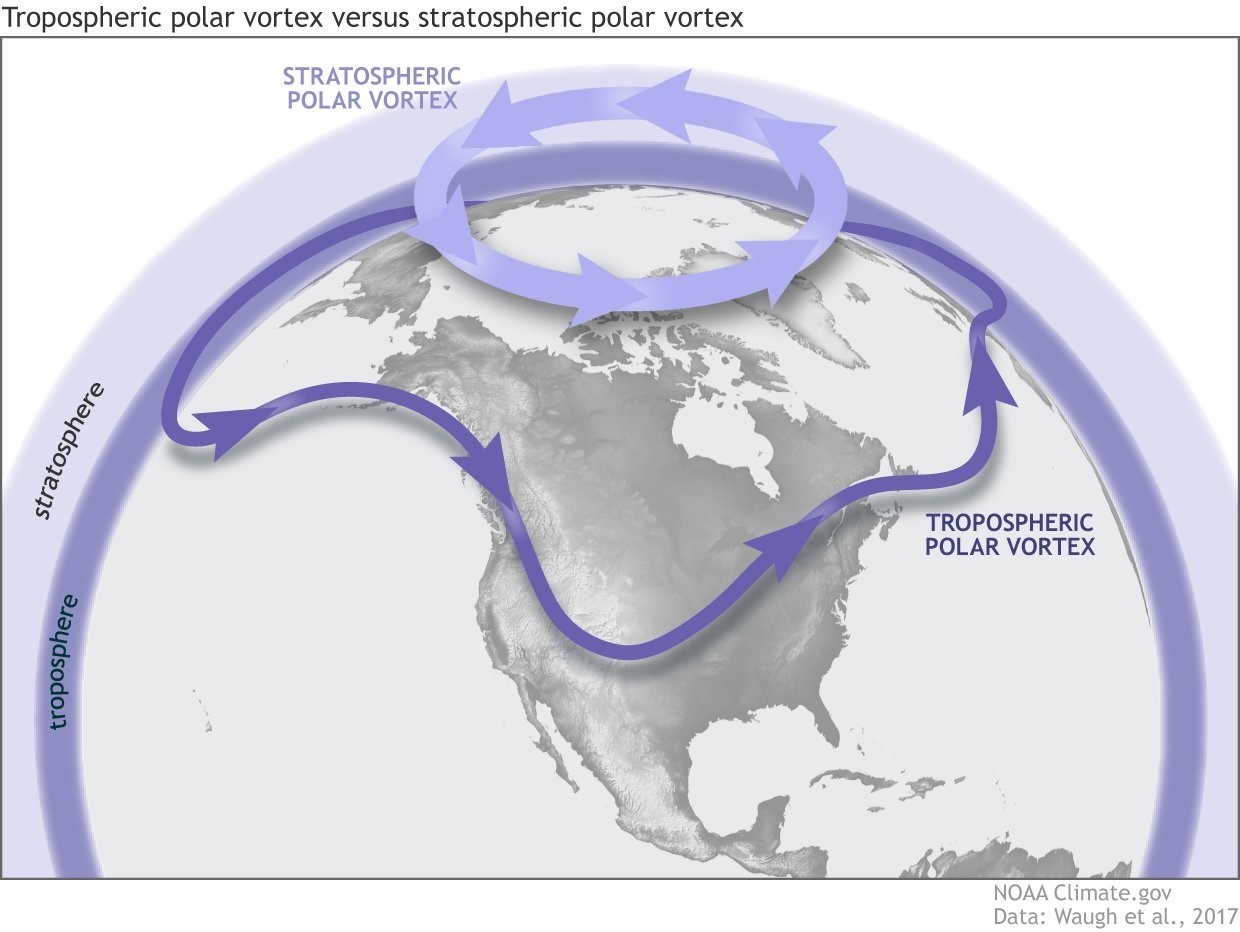
 The stratospheric polar vortex (SPV) is a rotating vortex of cold air high up in the stratosphere over polar regions. It forms every winter in the Northern Hemisphere and the strength of the Northern Hemisphere SPV has a significant influence on the Northern Hemisphere mid-latitude weather patterns. When the SPV is in a strong symmetrical state, it helps to maintain westerly momentum in the troposphere over polar regions and in the mid-latitudes, leading to our typical winter pattern of a strong west to east North Atlantic jetstream, bringing storms and weather fronts over Ireland from the west or southwest and keeping it mild and wet. When the SPV is in a weakened or non symmetrical state, it can lead to the weakened jetstream behaving more like a meandering river with blocking high pressure forming in our region, bringing the possibility of colder, drier weather.
When a weakened SPV goes through further disruption, it can lead to what is know as a Sudden Stratospheric Warming (SSW) event, which refers to the reversal of the zonal winds in the Stratosphere from westerly to easterly, along with a rapid jump in temperatures in the winter polar stratosphere that leads to a complete breakdown of the SPV. A SSW is now defined to have happened when the mean zonal wind (ZW) at 60°N and 10hPa (approx. 30km high) reverses to easterly. A SSW event usually has a significant impact on the tropospheric weather patterns in the mid latitudes. Following a SSW, there can be an equatorward shift of the tropospheric jetstream with associated cold conditions over northern Europe and these impacts can be long lasting. Every SSW is different and less than half of them lead to colder conditions in Ireland. For example, the SSW in February 2018 led to the ‘beast from the east’ and storm Emma, whereas the SSW in January 2019 had no significant impact here, due to the easterly winds not propagating down into the troposphere from the stratosphere. See more about the 2018 SSW event in a report on storm Emma here.
The current state and forecast for the SPV
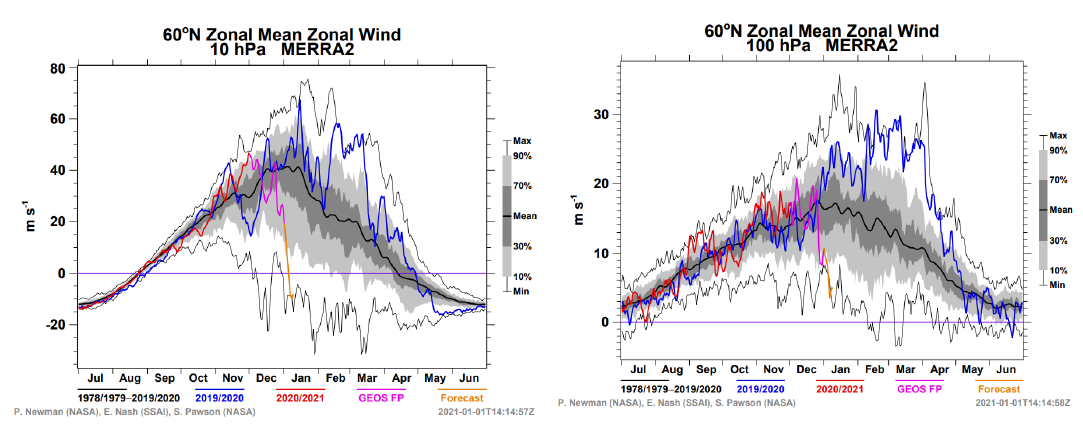
The SPV has been below average strength through most of December 2020 (pink line—left panel below) and is forecast to continue weakening (orange line –left panel below) to below zero m/s, which means changing from westerly to easterly. This signifies a technical SSW. The mean zonal winds at the bottom of the stratosphere have also been at very low levels (pink line— right panel below), and are forecast to decrease to record low levels over the next week (orange line– right panel below). This has been, and continues to be a contributing factor in the blocking high pressure systems we have seen in our region lately. The lack of westerly momentum at the bottom of the stratosphere helps to slow down the North Atlantic jetstream in the troposphere and leads to it meandering like a river, north to south, resulting in a more blocked pattern in the mid latitudes. Gsfc-nasa-gov
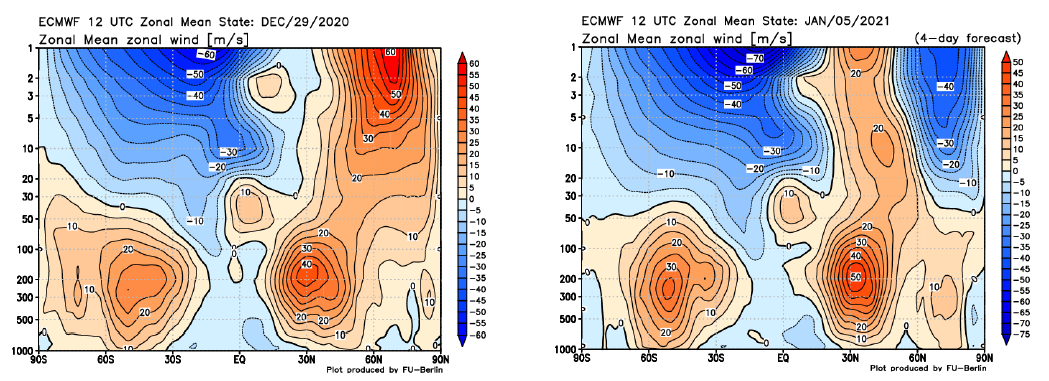
What this reversal looks like can be seen in the below charts. These show the zonal mean wind averaged around the globe at each latitude line. The orange and red colours signify westerly winds and the blue signify easterly winds, with the numbers on each contour showing the m/s value. The values on the x-axis represent latitude, with EQ meaning the Equator. The values on the y-axis represent height in hPa. For example 10 hPa is approximately 30km high and is in the stratosphere, where as 200 hPa is approximately 10km high and is the top of the troposphere. On the 29th December 2020 (left panel below) the zonal winds high up in the stratosphere between 60 and 90N were between 20 and 60 m/s westerly and the sub-tropical jetstream, at 30N and 200hPa height was at 40m/s westerly. The forecast for the 5th January 2021 (right panel below) show the polar stratospheric winds have reversed to between 20 and 40 m/s easterly and are beginning to propagate down into the lower stratosphere. The sub-tropical jetstream averaged around the whole globe has intensified to 50 m/s. Geo-fu-berlin
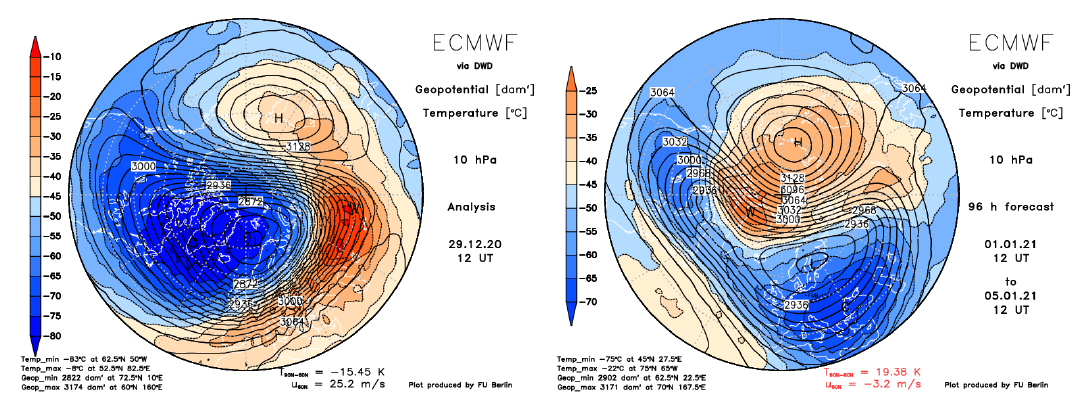
In the below charts, looking down from a northern hemisphere point of view at the 10 hPa height level (at the same times as above) the temperatures are represented by colours, with the °C values on the left and the geopotential height is represented by contours. On the 29th December 2020 (left panel below), the already weakened polar vortex, with its low pressure centre just to the northwest of Scandinavia, is surrounded by tightly packed height contours representing the strong westerly winds rotating anticlockwise around the vortex. The ZW at that stage was 25.2 m/s and can be seen at the bottom of the chart. There is already a strong warming signal over Siberia represented by the red colours. On the forecast chart for the 5th January 2021 (right panel below) the warming signal and associated high pressure has worked its way around and is penetrating into the polar vortex, pushing it further away from the north pole and almost splitting it. The more this high pressure pushes in over the north pole, the more the ZW changes from westerly to easterly. The ZW has reversed to easterly at this stage, shown by the -3.2 m/s at the bottom of the chart.
It is uncertain how this will affect our weather in the coming weeks as we are already in a very blocked setup. It could kick-start the westerly momentum in our region, at least temporarily, as the SPV is pushed over Scandinavia, leading to a strengthening of the North Atlantic jetstream, resulting in a more typical winter weather pattern for Ireland. It could also prolong and intensify the high latitude blocked setup leading to cold polar air masses flooding south into northern Europe or elsewhere in the mid latitudes.
Monthly Weather Forecast
Met Éireann are now issuing monthly forecasts twice a week, at 5pm every Tuesday and Friday, beginning 5th January. It will be available here in the Forecast menu. Monthly forecasting covers the time range of around 10 to 40 days ahead and is really more correctly described as sub-seasonal or extended-range. It is a time scale in between medium-range weather forecasting (10-day)* and seasonal forecasting (3 monthly).